
XLF – Technical Market Research
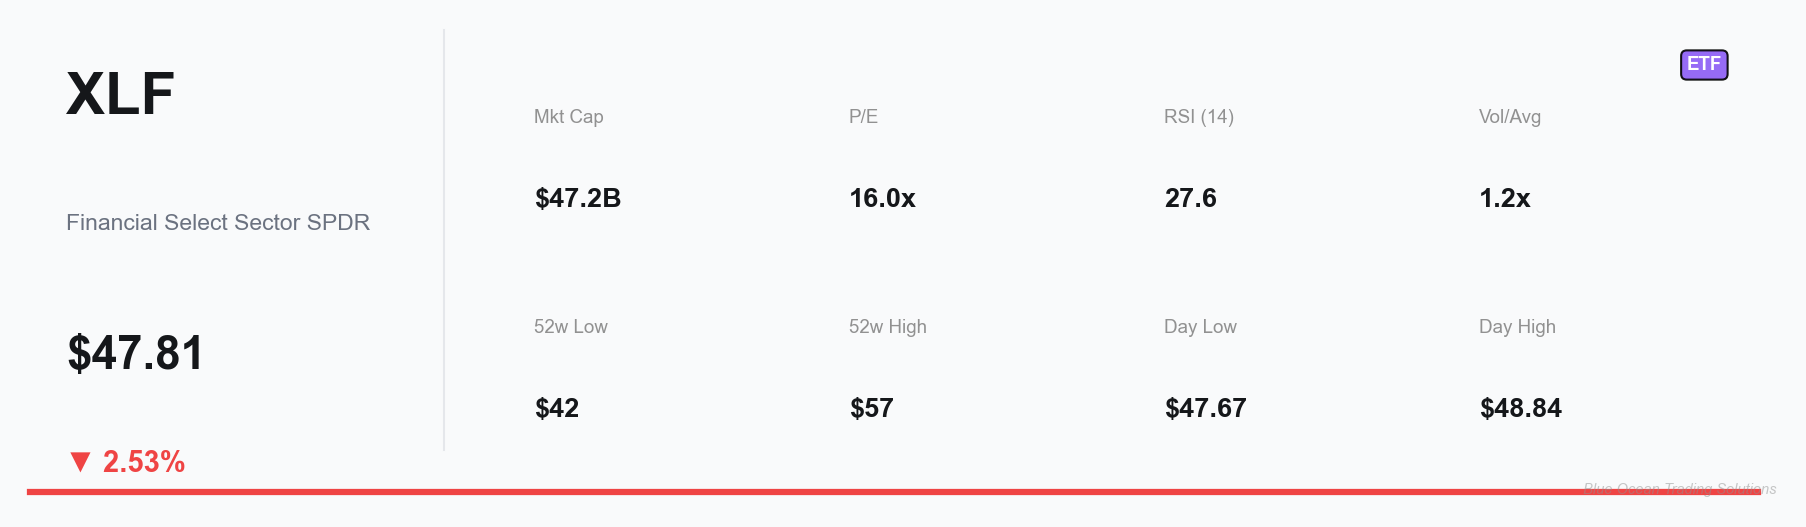
XLF trades at $47.81, deeply below the 20-week EMA, with RSI at 27.6. The financials sector is at a decision point as macro headwinds collide with extreme oversold conditions.

Published March 30, 2026 | ETF | XLF

Marcus Chen
ETF & Sector Strategist · Blue Ocean Trading Solutions
Technical Overview
XLF is trading at $47.81, well below its 20-week EMA of $51.93 — a structural posture that is unambiguously bearish. This isn’t a marginal violation; the ETF has sliced through that level and spent the last several weeks extending the distance. The 10-day EMA, sitting at $49.07, adds no comfort — price is trading beneath it as well, confirming that daily momentum is firmly aligned with the weekly bias. When the daily and weekly timeframes both point in the same direction, you don’t fight the tape. The structural posture here is bearish until proven otherwise.