
How the 20-Week EMA Defines Every Trade We Take
The single most important indicator on our charts. How the 20-week exponential moving average filters every trade we take, with this week's gold breakdown as the live example.


Sophia Marquez
Commodities & Macro Analyst · Blue Ocean Trading Solutions
This week, gold (GLD) closed below its 20-week exponential moving average for the first time in three months — $417.41 against an EMA of $428.04. That single weekly close did more than register a price decline. It flipped the structural bias for every gold-related trade we look at, from miners to silver to gold-correlated currencies. The 20-week EMA is the most important line on our charts. Here is why we use it, how it works mechanically, and how to apply it to your own trading.
Why the 20-Week EMA Is the Single Most Important Indicator on Our Charts
Every market regime has a structural pulse. The supply-demand balance for an asset shifts over the course of weeks and months, not minutes and hours. Whether you are trading energy, equities, or a sector ETF, the question that matters most is not "where is price going next bar?" but "is this asset in a bullish regime or a bearish regime, and is the regime intact?" The 20-week exponential moving average answers that question with a single, evolving line.
Twenty weeks is roughly 100 trading days, or just under five calendar months. It captures the rhythm of business cycles and earnings cycles in equities, the inventory cycle in commodities, and the fund-flow cycle in crypto and FX. It is long enough to filter out single-event noise — a Fed meeting, an earnings disappointment, a geopolitical shock — but short enough to react meaningfully when those events are reshaping the structural picture rather than producing noise.
The exponential weighting matters too. A simple moving average treats the close from twenty weeks ago the same as last week's close. The exponential moving average weights recent data more heavily, which means it adjusts faster when a real regime change begins. The result: a line that moves with the trend but does not chase the noise.
The Golden Rule: Trade With the Bias, Not Against It
Once you have the 20-week EMA on your weekly chart, the rule that follows is simple and absolute. We call it the Golden Rule:
If price closes above the 20-week EMA on the weekly chart, we only take long setups. If price closes below the 20-week EMA on the weekly chart, we only take short setups. Never against the higher-timeframe bias.
This rule is not a soft preference. It is a hard filter that throws out roughly half of every signal you might otherwise consider. Most traders who underperform are not doing so because they cannot read indicators. They are doing so because they are taking long trades in bear regimes and short trades in bull regimes — fighting the higher-timeframe trend — without realizing it. The 20-week filter eliminates that error mechanically.
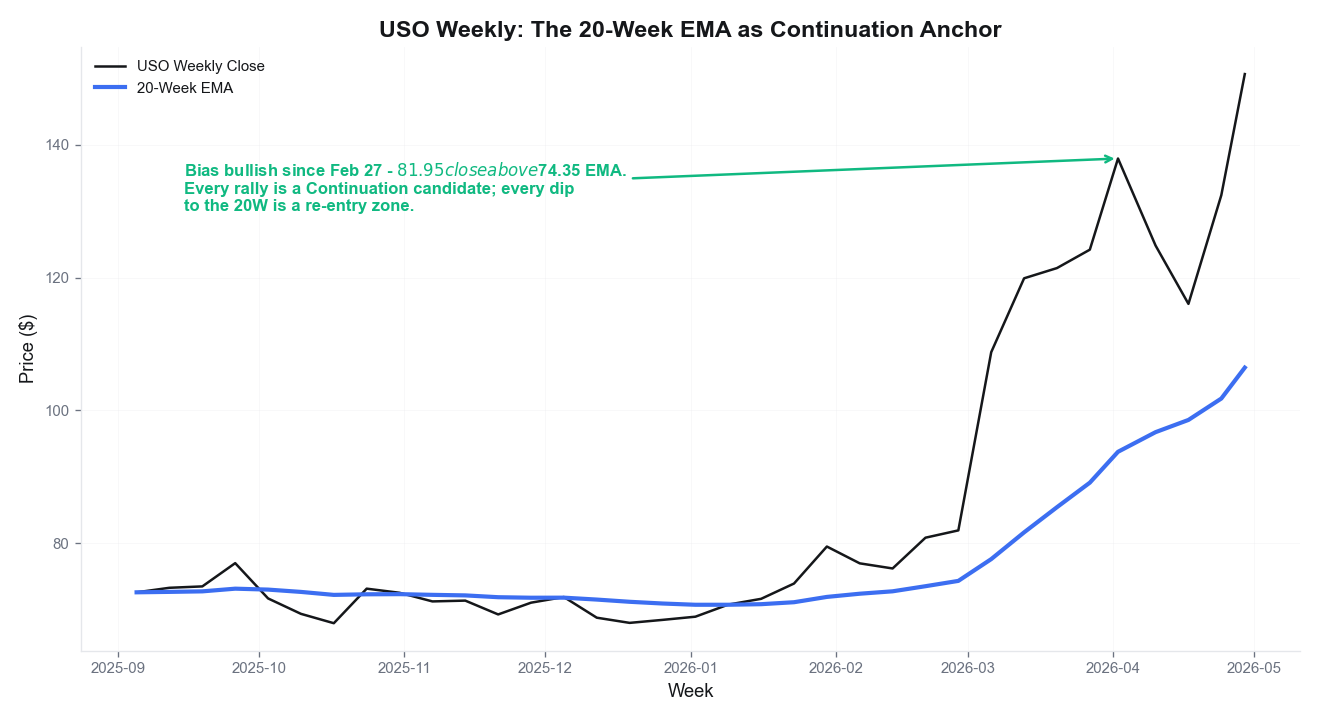
Crude oil has been a textbook example throughout 2026. The United States Oil Fund (USO) closed above its 20-week EMA at $74.35 on February 27 with a print of $81.95. Every week since, USO has remained above the 20-week, and the EMA itself has been rising — from $77.63 in early March to $106.45 this week. That is what an intact bullish regime looks like: price above the line, the line itself rising, the gap between price and the line widening or stable. Anyone trading crude during this period had one filter answer: longs only. Shorts taken inside this regime would have been counter-trend, low-probability trades regardless of how compelling the daily setup looked.
Gold This Week: A Live Example of the Filter Working
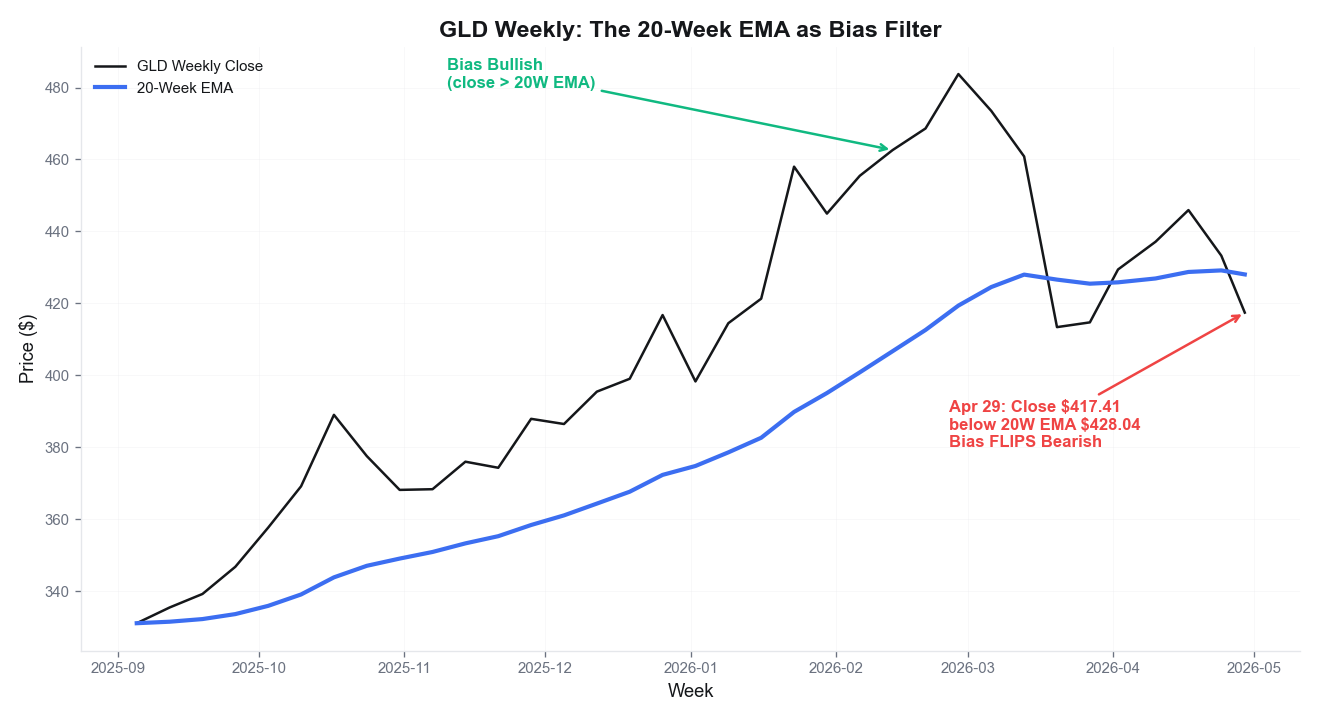
Gold's behavior this week is the perfect illustration of how the filter activates a regime change. SPDR Gold Shares (GLD) had been in a sustained bullish regime since November 2025. The weekly close on November 28 at $387.88 lifted price above its 20-week EMA at roughly $375, and from that point through April 17, every weekly close finished above the line. Through the late-2025 rally, the early-2026 surge to $483.75 by the end of February, and the March pullback to $413, the line held as support on every test.
The filter was clear during this entire period: longs only on gold. Anyone using the 20-week EMA discipline took only bullish setups in gold and the gold complex during a five-month run that captured most of the move from $375 to nearly $500 and back. The filter did not predict the top — no indicator does — but it provided the structural permission to participate in the trend.
This week changed the picture. The weekly close on April 29 came in at $417.41, with the 20-week EMA having advanced to $428.04. That is a clean break of $10.63, or roughly 2.5%, below the line. The bias filter has flipped. Going forward, until gold closes back above $428 on a weekly basis, the framework permits only short setups in gold and the closely correlated names — silver (SLV), gold miners (GDX), and the gold-currency proxy in the dollar.
This is the value of the filter. A trader without this discipline might have looked at the same gold chart this week and seen "a pullback in an uptrend" or "a buying opportunity at lower prices." A trader using the 20-week filter sees something specific: the structural regime has flipped, and any long setups during the next five months — until structure is reclaimed — are counter-trend trades that face elevated odds of failure. The filter is not telling you gold cannot rally. It is telling you that until the line is reclaimed, any rally is occurring inside a bearish regime, which means rallies fail more often than they succeed.
Why 20 Weeks Specifically? The Lookback Question
Traders who experiment with moving averages eventually discover that the lookback period — the number of bars the average is computed over — matters enormously. A 10-bar EMA is fast and noisy. A 200-bar EMA is slow and stale. The 20-week EMA sits in a specific sweet spot.
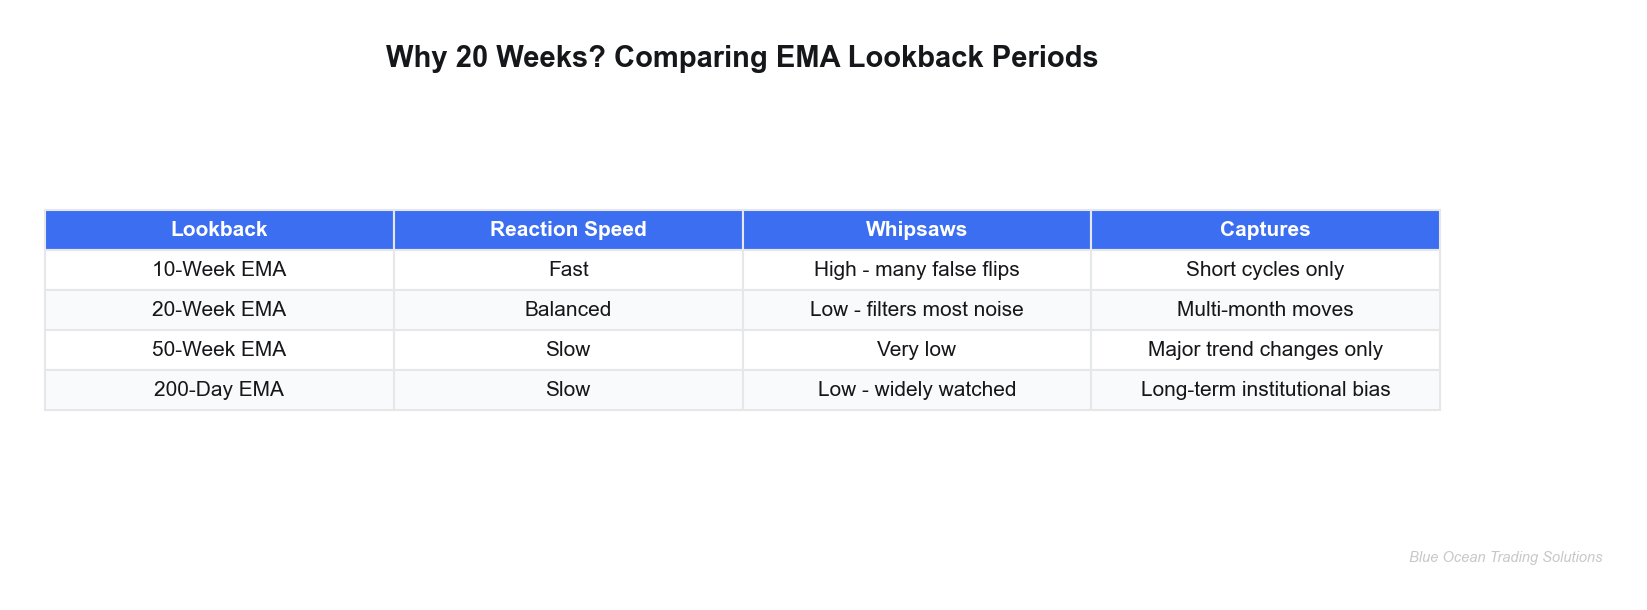
The 10-week EMA is too reactive for a structural filter. It produces dozens of "regime changes" per year on the same asset, most of which are false signals from individual events. Traders who use the 10-week as their structural filter end up taking trades in both directions on the same asset within a month, churning their P&L on whipsaws.
The 50-week EMA is too slow. It misses regime changes for months after they begin. By the time the 50-week confirms a new bull market in an asset, the easy money is gone and the trade has to be sized small to respect the now-distant invalidation. Worse, the 50-week creates dangerously confident exposure during the topping process — the line stays beneath price for months even as the underlying trend has decayed.
The 200-day moving average is widely watched as a generic institutional bias indicator, and it works for that purpose. But it is calibrated for daily charts and misses the cleanest weekly inflection points. The 20-week EMA aligns precisely with the rhythm of the market cycle: long enough to filter daily noise, short enough to confirm new regimes within a few weeks of when they begin.
The Four States of the Filter
The 20-week EMA filter has four distinct states, each carrying different conviction. Understanding which state your asset is in tells you not just whether to look long or short, but how aggressively to size when you find a setup.
State 1: Price above and EMA rising. The strongest bullish state. The trend is intact and accelerating. Long setups in this state carry the highest conviction. We size up to standard position size when this state is paired with confirmed entry signals on the daily chart. Crude oil throughout 2026 has been in this state — price above, EMA rising from $74 to $106 over six weeks. That is the kind of regime that makes long entries comfortable.
State 2: Price above but EMA flat. A weakening bull regime. The trend is intact — longs only — but momentum is fading. Position size should be reduced because the next state is often a flip to bearish. We watch for daily setups that fail to follow through, which is the early warning that the structural pulse is weakening.
State 3: Price below but EMA flat. A weakening bear regime. The structural bias is short, but the line is not yet rising — meaning sellers are no longer pushing the trend. Short setups still take precedence because the bias has not flipped, but reduced position size respects the possibility that we are in the late stage of a downtrend. This state often resolves with a reclaim attempt within four to six weeks.
State 4: Price below and EMA falling. The strongest bearish state. Sellers are in control of the higher timeframe and the line itself is rolling lower. Short setups carry the highest conviction. Gold appears to be entering this state right now: the late-March pullback initiated the rolling-over of the EMA, and this week's close below the line confirms the structural posture.
How to Apply This to Your Own Trading
The mechanics of using the 20-week EMA as a bias filter are simple, but the discipline is everything. Three rules cover most situations.
1. Check the weekly chart first, every time. Before any analysis on the daily chart, before any pattern recognition or entry-trigger evaluation, check whether the asset's weekly close is above or below its 20-week EMA. This determines which side of the trade you are eligible to take. If you cannot answer that question in three seconds, you have not done the structural work yet.
2. The line must hold on a weekly closing basis — not intraweek. Markets routinely test the 20-week EMA intraweek and reject it. Those are noise. The signal is the Friday close. If price spent most of the week below the line but recovered into Friday and closed above, the bullish regime is intact. If price spent most of the week above the line but rolled into Friday and closed below, the regime has flipped. We never act on intraweek violations of the line.
3. Apply the filter to every asset class. The 20-week EMA works on equities, ETFs, commodities, crypto, currencies, and fixed-income vehicles. The mechanics do not change because the underlying instrument is different. We apply the same filter to gold, to the S&P, to bitcoin, to silver, to crude, to the dollar index. Universality is the point: one rule, applied consistently, beats five rules applied inconsistently.
A note on stops and risk management. The 20-week EMA defines the bias filter, but it does not define the stop loss for individual trades. The stop on any trade comes from the daily chart structure — specifically, the nearest daily swing level on the opposite side of the trade. The 20-week EMA tells you which direction to look for setups; the daily structure tells you where to place the invalidation. Confusing these two functions is one of the most common errors among traders who first encounter the framework.
Where the Filter Fails — And How to Recognize It
Like every framework, the 20-week EMA has known failure modes. Understanding them is part of using the filter responsibly.
Sideways markets. When an asset trades in a tight horizontal range for several months, weekly closes can repeatedly cross the 20-week EMA from both sides. Each crossing technically flips the bias, but the trades that result tend to be whipsaws. The honest read in this case is: the asset is rangebound, the filter is unreliable, look elsewhere. Filter health is not a constant; it is highest when an asset is trending and lowest when it is consolidating.
Earnings or event gaps. A single overnight gap that opens above or below the 20-week EMA on a Friday creates an artificial regime flip that often reverses. We do not act on the same Friday close that follows a major catalyst gap; we wait for the following weekly close to confirm whether the new regime is real.
Asset-specific anomalies. Highly leveraged ETFs (SPXL, TQQQ), inverse ETFs, and very low-liquidity micro-caps can exhibit price action where the 20-week EMA produces unreliable signals. We restrict the filter to liquid spot-market instruments and futures-based ETFs. Leverage and structural decay distort the signal beyond useful tolerances.
The Filter as the Foundation
The 20-week EMA is not a complete trading system on its own. It is a filter — the first decision in a longer chain. After the bias filter establishes the direction, the daily chart provides entry timing, the daily swing structure provides the stop, the weekly swing structure provides the target. Layered together, these create the Two-Timeframe Edge: a complete framework where the higher timeframe sets bias and the lower timeframe executes.
But the filter is the foundation. Get the bias filter right, and your win rate improves before you have learned a single entry pattern. Get it wrong, and no entry technique can compensate for trading against the trend. This is why we say the 20-week EMA is the single most important indicator on our charts. It is not just one tool among many. It is the tool that determines whether all the other tools are pointing in a useful direction.
If you want to see the full Two-Timeframe Edge framework — how we layer entry signals, stop placement, target identification, and judgment-layer risk management on top of the bias filter — subscribe to Blue Ocean Trading Solutions. The Pre-Market Brief delivers the framework applied across every major asset class, every trading day.
Disclaimer: This article is for informational and educational purposes only and does not constitute investment advice, a solicitation, or a recommendation to buy or sell any security or digital asset. All analysis is based on publicly available data and technical observations. Past performance is not indicative of future results. Trading involves substantial risk of loss. Always conduct your own due diligence and consult a qualified financial advisor before making investment decisions. Blue Ocean Trading Solutions and its analysts may hold positions in securities discussed.