
TZA – Technical Market Research
Comprehensive technical analysis of TZA (Direxion Daily Small Cap Bear 3X ETF) covering price action, RSI momentum, leverage mechanics, macro backdrop, and the bearish small-cap rotation picture.


Published March 16, 2026 | ETF | TZA

Marcus Chen
ETF & Sector Strategist · Blue Ocean Trading Solutions
Technical Overview
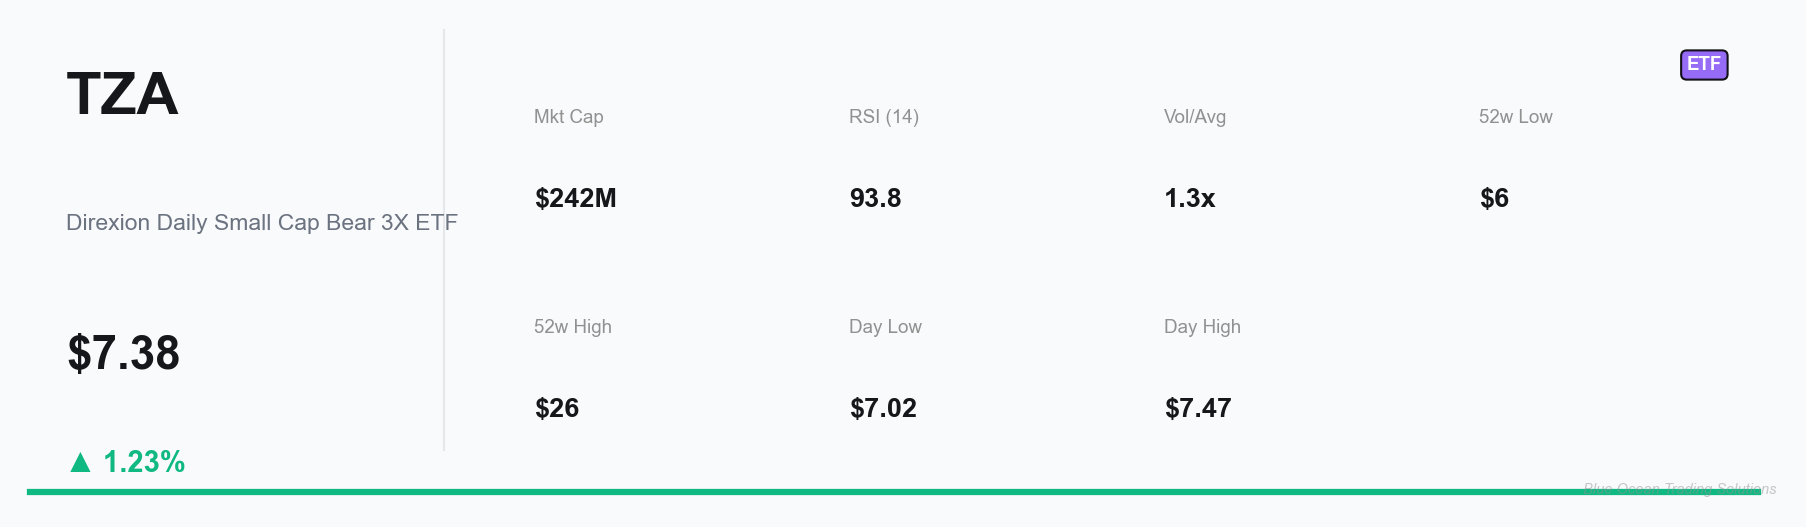
The rotation picture for TZA tells a story that has been building quietly since the final weeks of February, and it is now registering at a level that demands attention. After spending the better part of November through late February in a sustained compression band between roughly $6.20 and $7.55, the fund has staged a decisive directional move in recent sessions — closing at $7.38 on March 13, up from a February trough of $6.23. That represents a 18.5% advance off the near-term floor in fewer than three weeks, a pace that is unusually brisk even for a 3x leveraged instrument within a single month-long window.