
NVDA – Technical Market Research
Comprehensive technical analysis of NVDA covering price action, momentum, fundamental context, and the macro backdrop.


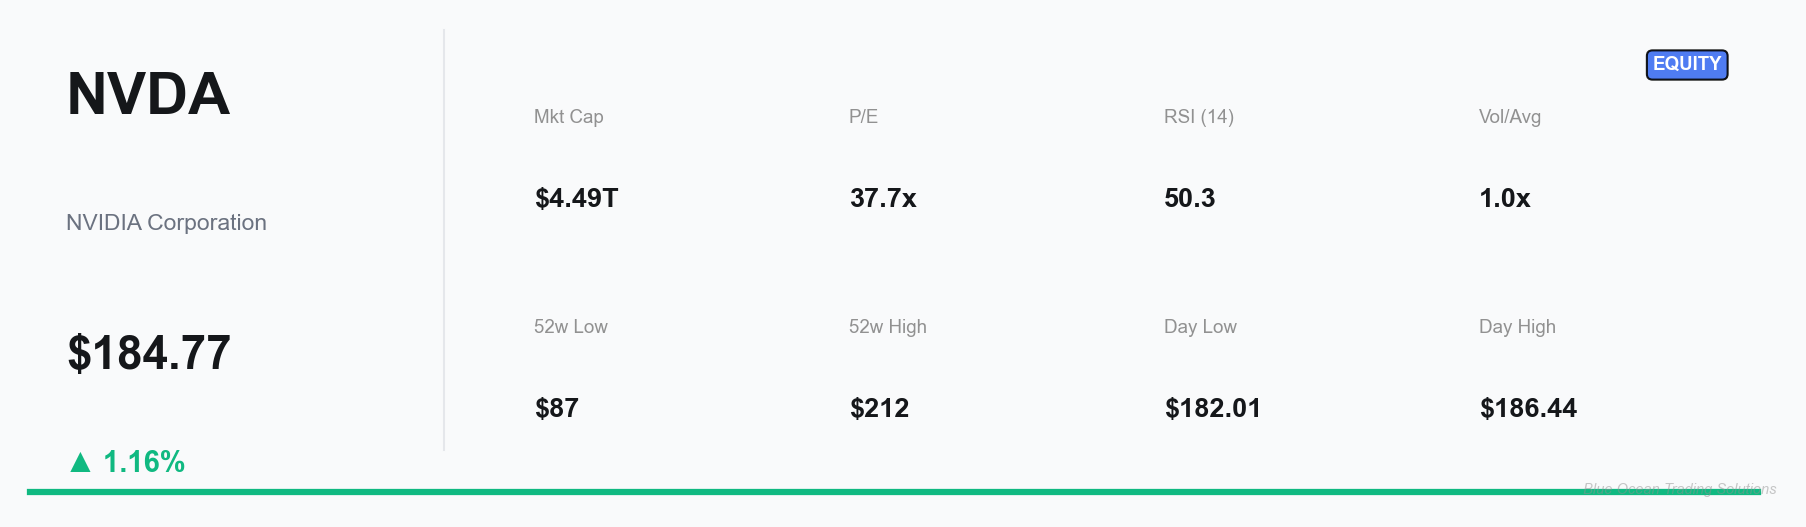
NVIDIA Corporation (NVDA) enters the session at $184.77, up 1.16% in pre-market trading as of March 11, 2026. The tape suggests a stock at an inflection point — consolidating below the $195 resistance shelf after a volatile post-earnings flush, with RSI at 50.3 signaling neither exhaustion nor conviction. The risk/reward profile here is defined on both sides, and price action is telling us the next leg depends on whether GTC 2026 catalysts can break the inertia.

Rachel Kensington
Senior Equity Analyst · Blue Ocean Trading Solutions
1. Technical Overview
The six-month chart tells a story in three acts. From mid-September through late November, NVDA traded a tight range in the $175–$190 band — constructive consolidation after the post-DeepSeek shock that wiped $600 billion in market cap in January 2025. Act two: a powerful breakout in late November through early December carried the stock from $183 to a 52-week high of $212.19, powered by blow-out Q4 FY2026 earnings (revenue $68.1B, up 73% YoY) and guidance that stunned even optimistic Street estimates ($78B for Q1 FY2027). Act three: the reversal. A swift pullback from $207 on February 26 to a post-earnings low near $171 in early March — a 17% drawdown in ten sessions — before buyers stepped back in. The tape suggests the selling was supply absorption, not fundamental deterioration.