GLD – Technical Market Research
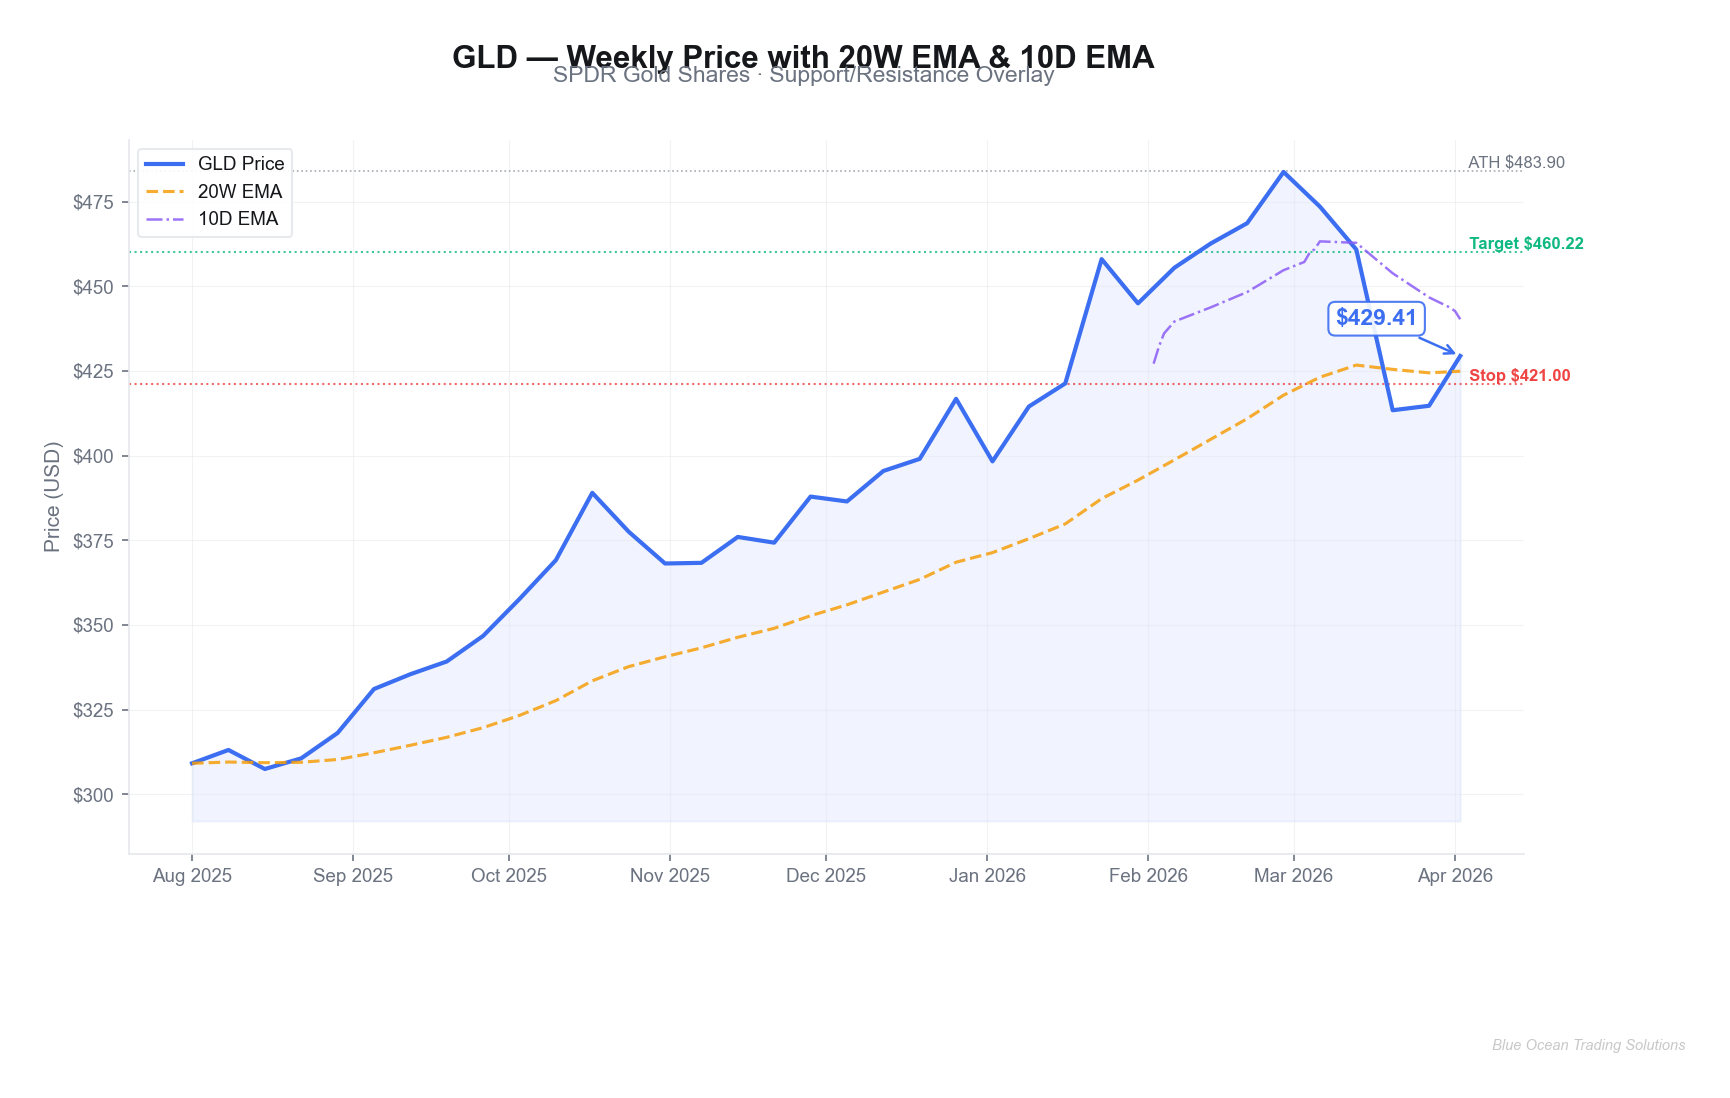
GLD holds above its 20W EMA at $424.90 after a 16% correction — a bullish continuation setup with a $460.22 target, $421.00 stop, and 3.7:1 R:R. Dollar weakness and structural central bank buying underpin the case.

Published April 7, 2026 | Commodities | GLD

Sophia Marquez
Commodities & Macro Analyst · Blue Ocean Trading Solutions
1. Technical Overview
GLD sits above its 20-week EMA at $424.90 — the structural posture is bullish, and that designation has earned its keep. Gold spent the better part of seven months grinding steadily higher before running into serious volatility in late January 2026, when a sharp reversal unraveled the February highs with surprising speed. From the $483.90 peak on February 27 to the $405.41 trough on March 27, GLD shed 16.2% in four weeks — a correction that at its worst threatened to drag the metal back below its 20-week EMA and flip the structural posture neutral. It did not. The 20-week EMA held as support. GLD closed the April 2 week at $429.41, $4.51 above that critical EMA line.
What does that 16% correction tell us about conviction? On balance, more good than bad. The pullback was sharp but orderly — not a liquidity crisis or structural breakdown, but a technically motivated unwinding of extended longs. Gold had run from $309 in August 2025 to $484 in late February: a 56% move in seven months. A correction to the 20-week EMA (which was itself rising fast) is precisely the kind of reset that keeps a trend healthy. The buyers who stepped in at $405–$411 weren’t panicking in — they were defending a level. That distinction matters. Panicked buyers don’t create swing lows with $421 daily support sitting just above them.
The 10-day EMA stands at $448.55 — notably above current price at $429.41. That gap is the honest read on momentum: the daily trend is recovering from the correction but hasn’t fully re-established upward momentum. The 10-day EMA is sloping downward from the $460–$473 levels of early March, and price needs to close back above it with conviction to signal that the continuation setup is fully activated. The April 1 session hit $440.19 before sellers stepped back in on April 2, leaving the close at $429.41 on a down session. Momentum is cautious, not broken.
Volume context is instructive. The week of March 20 printed 27.2 million shares — one of the highest-volume weeks in the dataset — on a sharp down move. Selling climax characteristics. The following week, March 27, saw 16.6 million on a range-bound week, and the April 2 week printed 10.8 million — volume drying up as price stabilizes. Classic accumulation signature: high-volume flush, lower-volume stabilization, and rising EMA support acting as a floor. This is what the beginning of a continuation looks like.