
FUFU – Technical Market Research
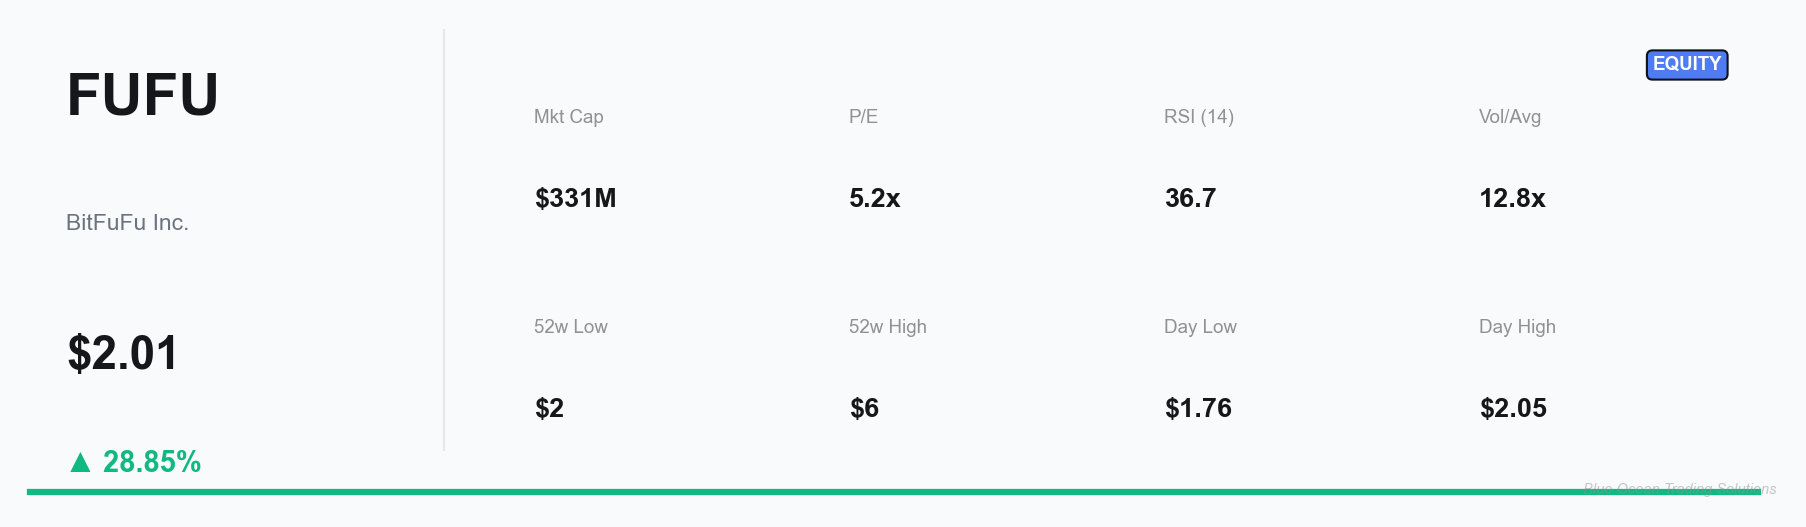
BitFuFu (FUFU) bounced 28.85% on 12.8x average volume after hitting a 52-week low. Full technical and fundamental breakdown of the Bitcoin mining play.


Published March 24, 2026 | Equity | FUFU

Rachel Kensington
Senior Equity Analyst · Blue Ocean Trading Solutions
Technical Overview
The tape on FUFU tells a story of a stock that has been in sustained distribution since peaking near $5.85 in November 2025 — a 66% decline to its March 20 intraday low of $1.56. Price action on the 6-month chart is unambiguously bearish: a stair-step series of lower highs and lower lows, with each attempted rally failing at progressively lower resistance. The 20-day and 50-day moving averages are in a bearish configuration, slope negative, and price has consistently closed below both for the entirety of the Q1 2026 period.