
BITO – Technical Market Research
Comprehensive technical analysis of BITO covering price action, momentum, fundamental context, and the macro backdrop entering the March 2026 FOMC decision.


Published March 17, 2026 | ETF | BITO

Marcus Chen
ETF & Sector Strategist · Blue Ocean Trading Solutions
Technical Overview
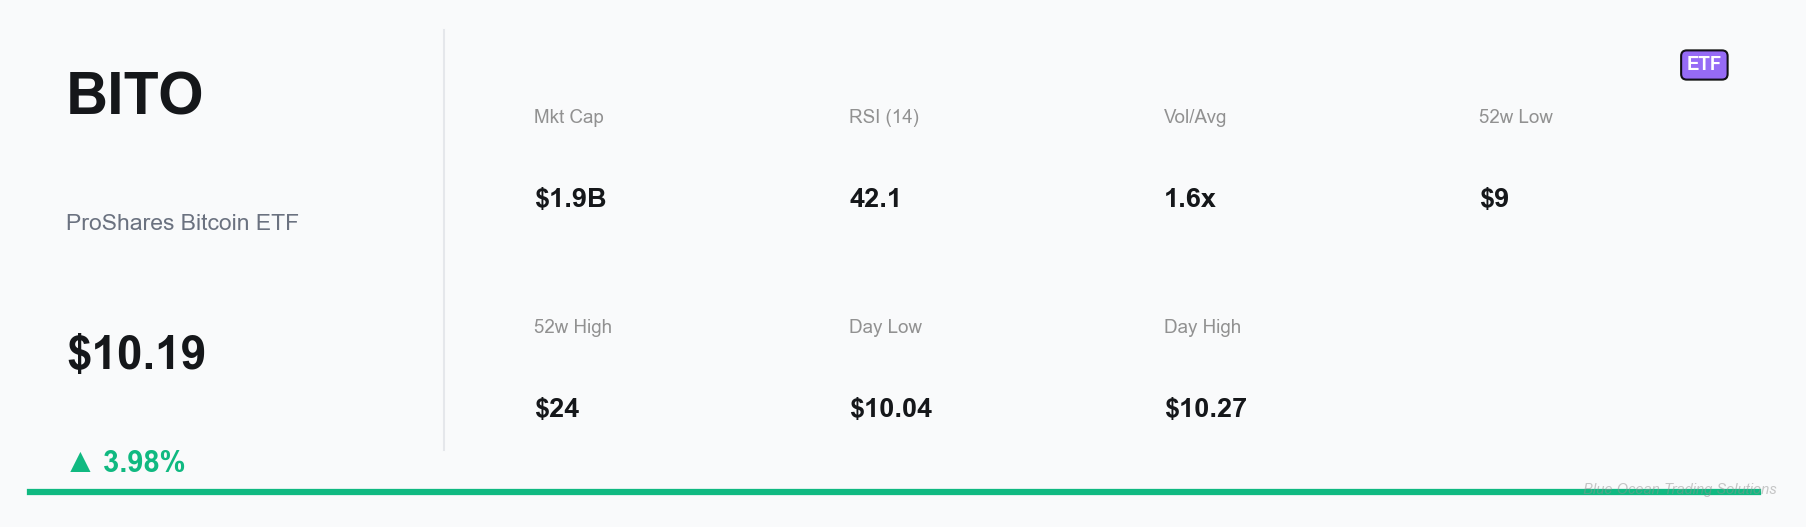
The six-month price chart for ProShares Bitcoin ETF (BITO) tells a clear story of structural deterioration followed by base-building at compressed valuations. From a September 2025 opening near $20, the fund traced a steady downtrend that accelerated sharply in late February and early March 2026, carving through successive support shelves until reaching its 52-week low of $8.61 in early March. The current price near $10.19 represents a partial recovery from that capitulation low — approximately 18% off the trough — though the structural damage to the trend remains intact. The broader price structure is a descending channel: each rally attempt since October has found a ceiling at progressively lower levels, from $20.75 to $18.93 to $14.07, and now the near-term test of the $10.50 area.