The Two-Timeframe Edge: A Complete Moving Average System for Swing Traders
Most swing traders use one timeframe when they need two. The 20-week EMA sets your directional bias. The 10-day EMA triggers the entry. Together, they form a complete framework — but only when the cross is fresh.


James Whitfield
Markets Desk Editor · Blue Ocean Trading Solutions
1. Why Two Timeframes Change Everything
Most swing trading mistakes don't happen at the setup level. They happen one step earlier — when a trader uses only one timeframe to make a decision that requires two. The daily chart shows a clean bounce off support, the RSI is recovering, the candle looks right. What it doesn't show is that the weekly chart is rolling over below its 20-week EMA, with distribution written all over a six-week topping pattern. You're buying into a structure that has already decided where it's going. You just couldn't see it from where you were standing.
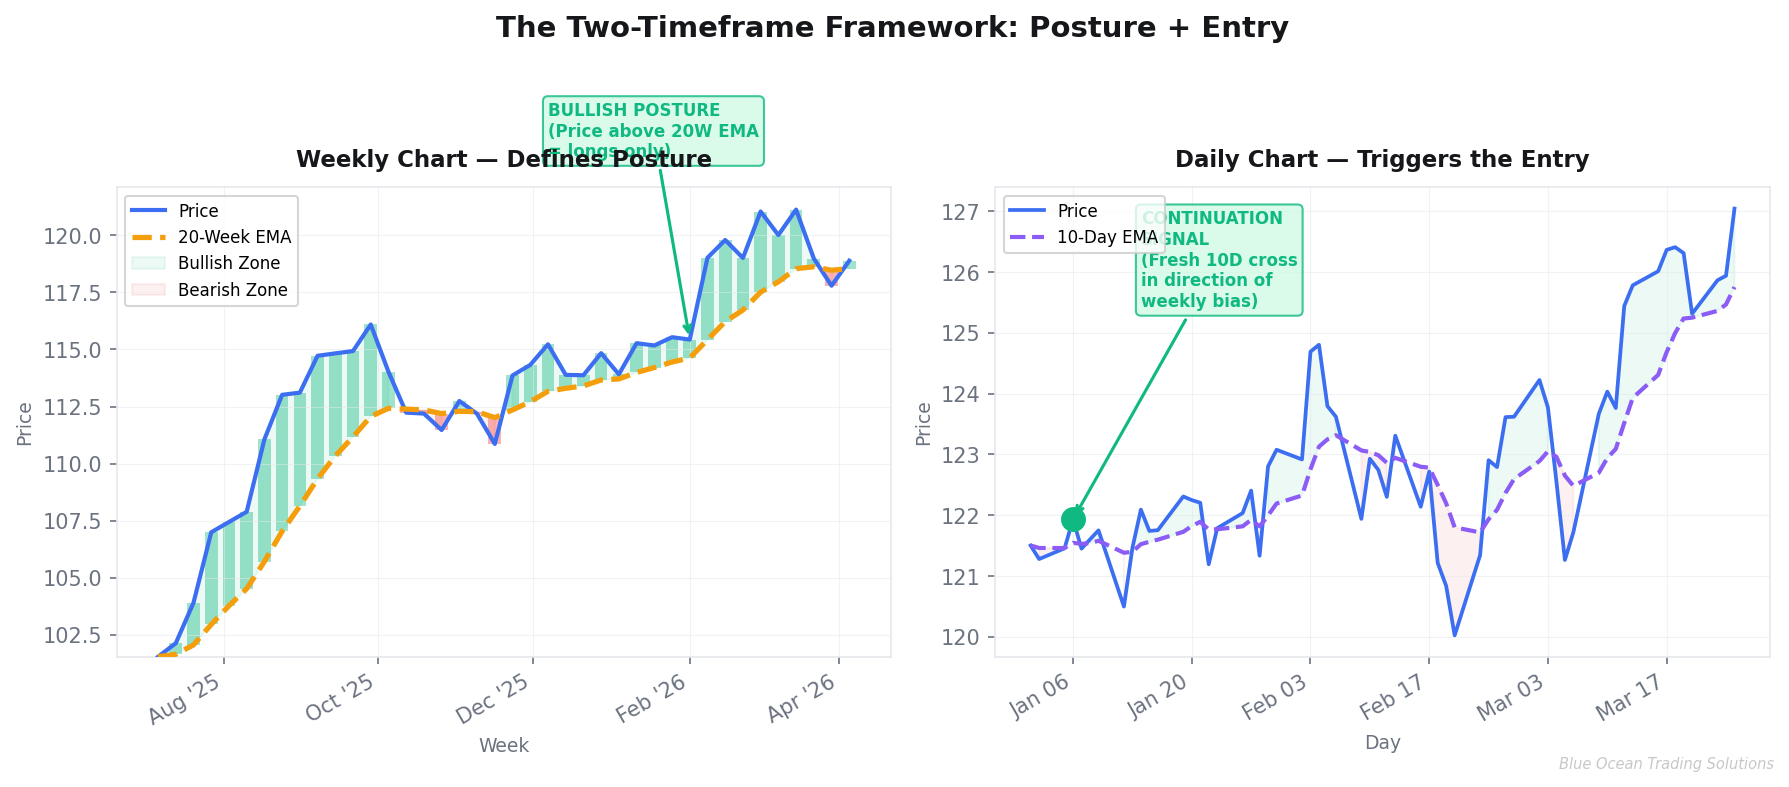
The Two-Timeframe Edge is built around a simple but powerful idea: the weekly chart sets the context, and the daily chart provides the entry. These two timeframes serve entirely different functions. Conflating them — making directional decisions based on a daily bounce when the weekly is in a bearish posture — is one of the most common and costly mistakes in swing trading.
This framework uses just two moving averages: the 20-week EMA on the weekly chart, and the 10-day EMA on the daily. No oscillators, no volume indicators stacked on top of indicators, no competing signals. The signal architecture is clean because the logic is clean.
2. The 20-Week EMA: Your Posture Indicator
The 20-week EMA is the structural anchor of this framework. It spans roughly five months of price history — long enough to filter out short-term noise, short enough to be responsive when the trend genuinely shifts. Every asset in the framework is evaluated against this single line.
The rule is binary: a weekly close above the 20-week EMA = bullish posture. A weekly close below = bearish posture. Bullish posture means you are looking for long setups only. Bearish posture means you are looking for short setups only. There is no middle ground, and there are no exceptions.
The Golden Rule
Never trade against the higher-timeframe bias. A strong rally on a bearish-posture asset is a rally into resistance — not a buy signal. A pullback on a bullish-posture asset is a dip into support — not a sell signal. This rule applies without exception.
This evaluation is done per asset. SPY can be in bearish posture while GLD is in bullish posture. XLE can be bearish while XLK is bullish. The 20-week EMA gives you an independent read on each asset's structural bias — which is exactly what you need when rotating between sectors and markets. You are not trading the market. You are trading specific setups within specific structures, and each structure needs its own read.
A common mistake is treating the 20-week EMA as a price target or a level to fade. It isn't. It's a posture indicator — it tells you which side of the market a trader should be on for that asset. That's all it does, and that's enough.
3. Two Entry Signals — and Why the Timing Is Everything
Once you have the weekly posture, you need a trigger. That trigger comes from the daily chart, and there are two types: the Initial signal and the Continuation signal. Understanding the distinction — and more importantly, understanding that timing is what makes them valid — is where most traders fall short.
Initial signal: Price crosses the 20-week EMA — moving from one posture to another. A bullish Initial signal occurs when a stock that has been below its 20-week EMA crosses back above it. This is the first opportunity to participate in a new trend. The critical qualifier: the cross must have happened within the last one or two bars. If the cross occurred three weeks ago, you are not getting an Initial signal — you are entering a trend that is already underway, with a stop that is now far away and an entry that has been diluted. The signal type tells you the character of the move. The timing tells you whether you still have an edge.
Continuation signal: After the weekly posture has been established for multiple weeks, a pullback to the 10-day EMA followed by a fresh cross back in the direction of the weekly bias is a Continuation entry. The 10-day EMA is the daily trend-following mechanism. A bullish-posture stock that pulls back to its 10-day EMA and recrosses above it gives swing traders a clean, lower-risk re-entry. Again — the cross must be recent. An asset that has been sitting comfortably above its 10-day EMA for two weeks without a recent cross has no active signal. The posture is right, but there is no trigger.
Common Mistake: Confusing Posture with Signal
A bullish posture is a direction. It is not a trade idea. The moment you say "this stock is above its 20-week EMA, so I should buy it," you have turned a structural read into a forced entry. The framework requires a fresh cross — not just favorable positioning. Bullish posture + stale setup = no trade.
4. SPY — What a Real Initial Signal Looks Like
The S&P 500 provided a textbook example of an Initial bearish signal in the first quarter of 2026. From January through most of February, SPY held a bullish posture — closing consistently above its 20-week EMA in the $670–695 range. The structure was intact. There was nothing bearish to act on.
The shift came progressively through March, as SPY lost the 20-week EMA and crossed below it with conviction. That cross — specifically, the bar where weekly close moved below the EMA — was the Initial bearish signal. At that moment, the posture flipped to bearish: no more long setups, shorts only. The stop for anyone trading the Initial short signal sits above the nearest daily swing high (which was the resistance zone around the EMA itself). The target is the nearest weekly swing low in the direction of the trade.
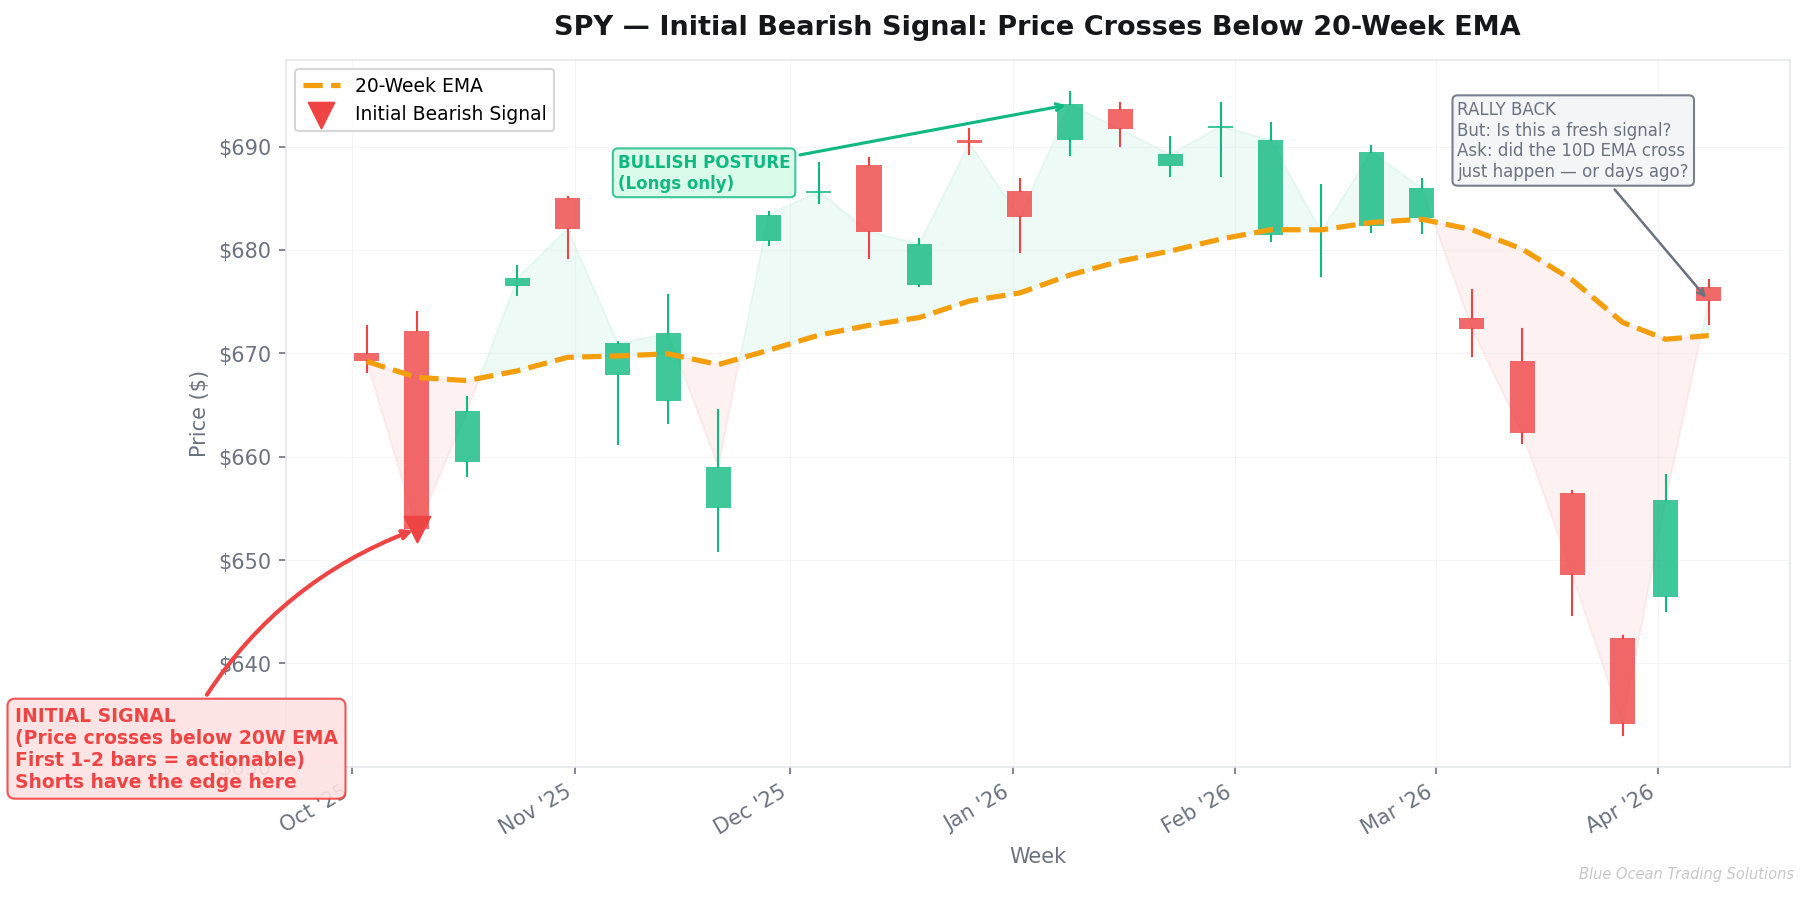
Note what the chart also shows: after the initial breakdown, SPY staged a sharp recovery rally back toward the EMA zone in early April. Here is where the framework's judgment layer matters. The question is not "has it recovered?" The question is: "Did a fresh cross just occur?" If SPY closed back above the 20-week EMA in week one of April, that could mark a new Initial bullish signal — but only if the cross happened recently. If the EMA has been reclaimed for two weeks and you are entering now, you are chasing. You've missed the entry.
Risk management for the Initial signal: the stop goes at the nearest daily swing on the opposite side of the trade. For a bearish Initial, that means the nearest daily swing high — the resistance point where, if price reaches it, the thesis is genuinely wrong. Minimum 1.5:1 reward-to-risk. Below that threshold, the setup doesn't qualify, regardless of how clean the structure looks.
5. GLD — Continuation Signals Within a Sustained Trend
Gold's ETF, GLD, illustrated the Continuation signal over the six months from October 2025 through March 2026. The asset maintained a bullish weekly posture through most of this period, with the 20-week EMA rising steadily as gold pushed from the mid-$350s toward peak levels near $484. Multiple clean Continuation opportunities presented themselves along the way.
The pattern repeats: GLD rallies, pulls back to the 10-day EMA on the daily chart, and then recrosses above it. Each fresh recross in the direction of the bullish weekly bias is a Continuation signal. The trader who understands this doesn't chase the initial move — they wait for the EMA to be retested, and they enter on the cross. The risk is defined. The direction is confirmed by the weekly structure. The entry is triggered by the daily retest.
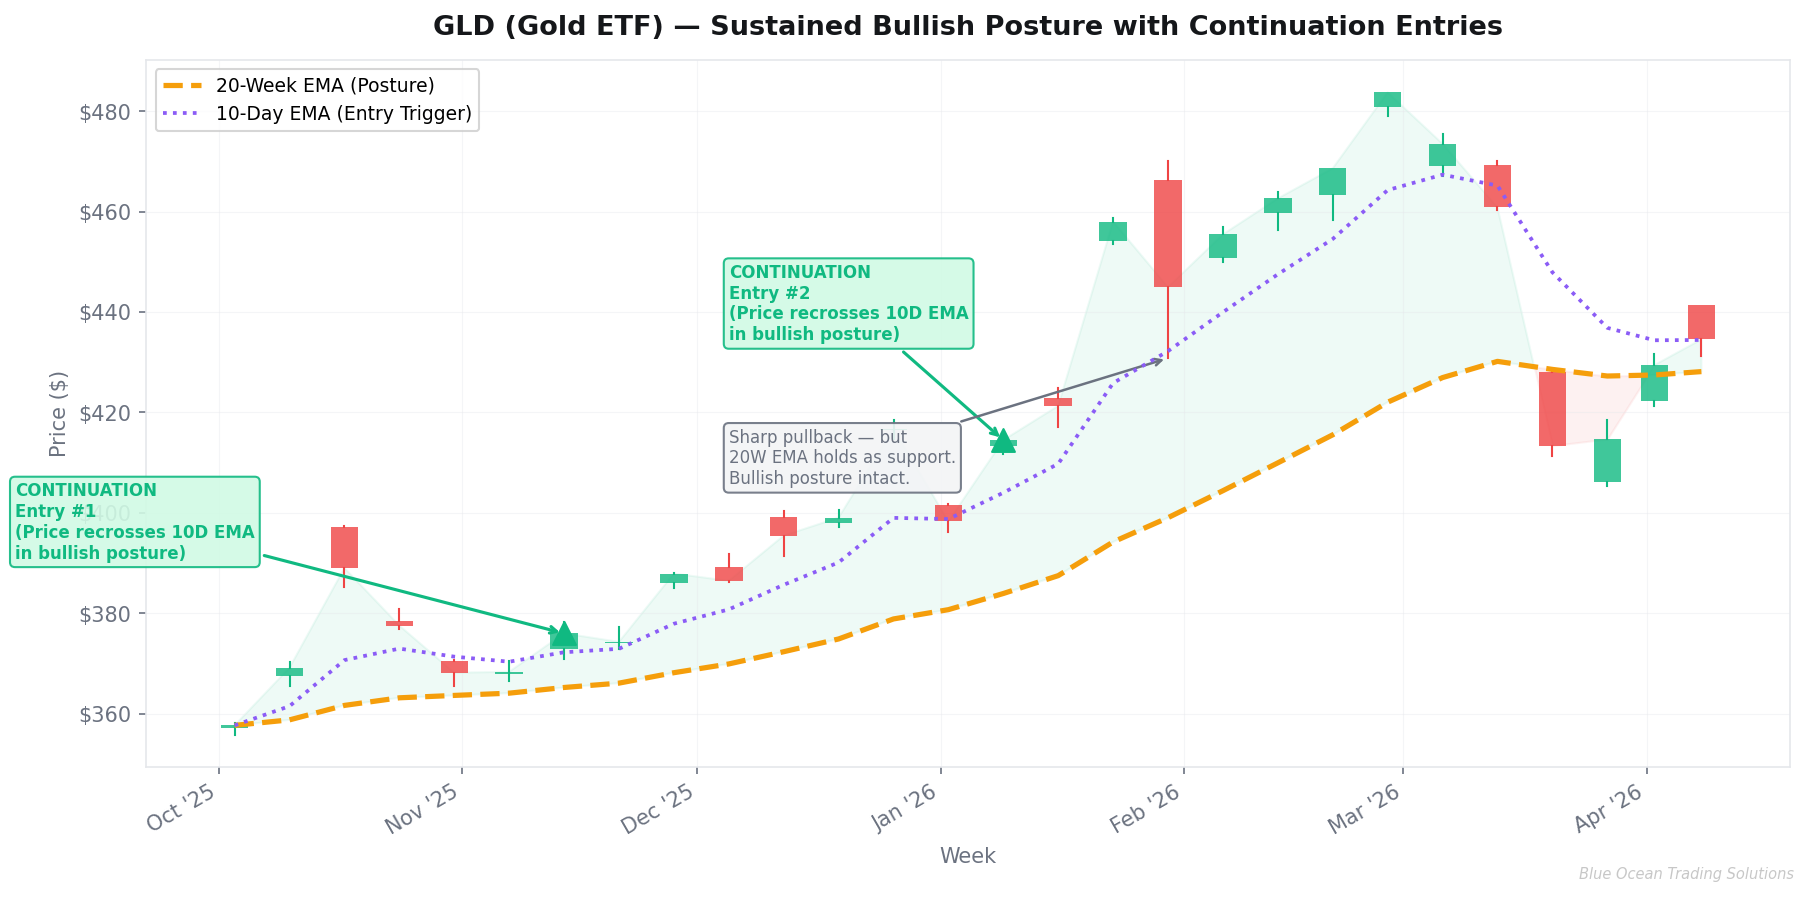
The sharp pullback visible in late January — where GLD sold off from the $470 area toward $430 intraday before recovering — is worth examining. In the moment, that kind of move can rattle a swing trader. But the weekly chart told the real story: GLD held above its 20-week EMA at the weekly close. The pullback was deep, but the posture was intact. The next Continuation signal came when the daily 10-day EMA was recrossed to the upside — and that entry had cleaner reward-to-risk than any chase into a new high would have offered.
Continuation targets follow the same logic as Initial targets: the nearest weekly swing high in the direction of the trade. If there are prior weekly swing highs creating visible overhead supply before the theoretical target, the realistic target is that resistance level — not the mathematically derived 2R calculation. Honest targets improve the framework's track record over time.
6. The Trader's Eye: When the Framework Says Yes but Experience Says Wait
The mechanical framework is the foundation. The Trader's Eye is what determines whether that foundation supports an actionable trade or just a direction. These are different things, and the distinction is where experienced traders separate themselves from algorithmic pattern-finders.
Consider this scenario — one that presents itself regularly in trending markets. An asset has been in a bullish weekly posture for fourteen weeks. It's running 12% above its 20-week EMA. The 10-day EMA is well below the current price, with no recent cross. The posture check passes. The direction is correct. But there is no active signal — because neither an Initial nor a Continuation cross occurred in the last one or two bars.
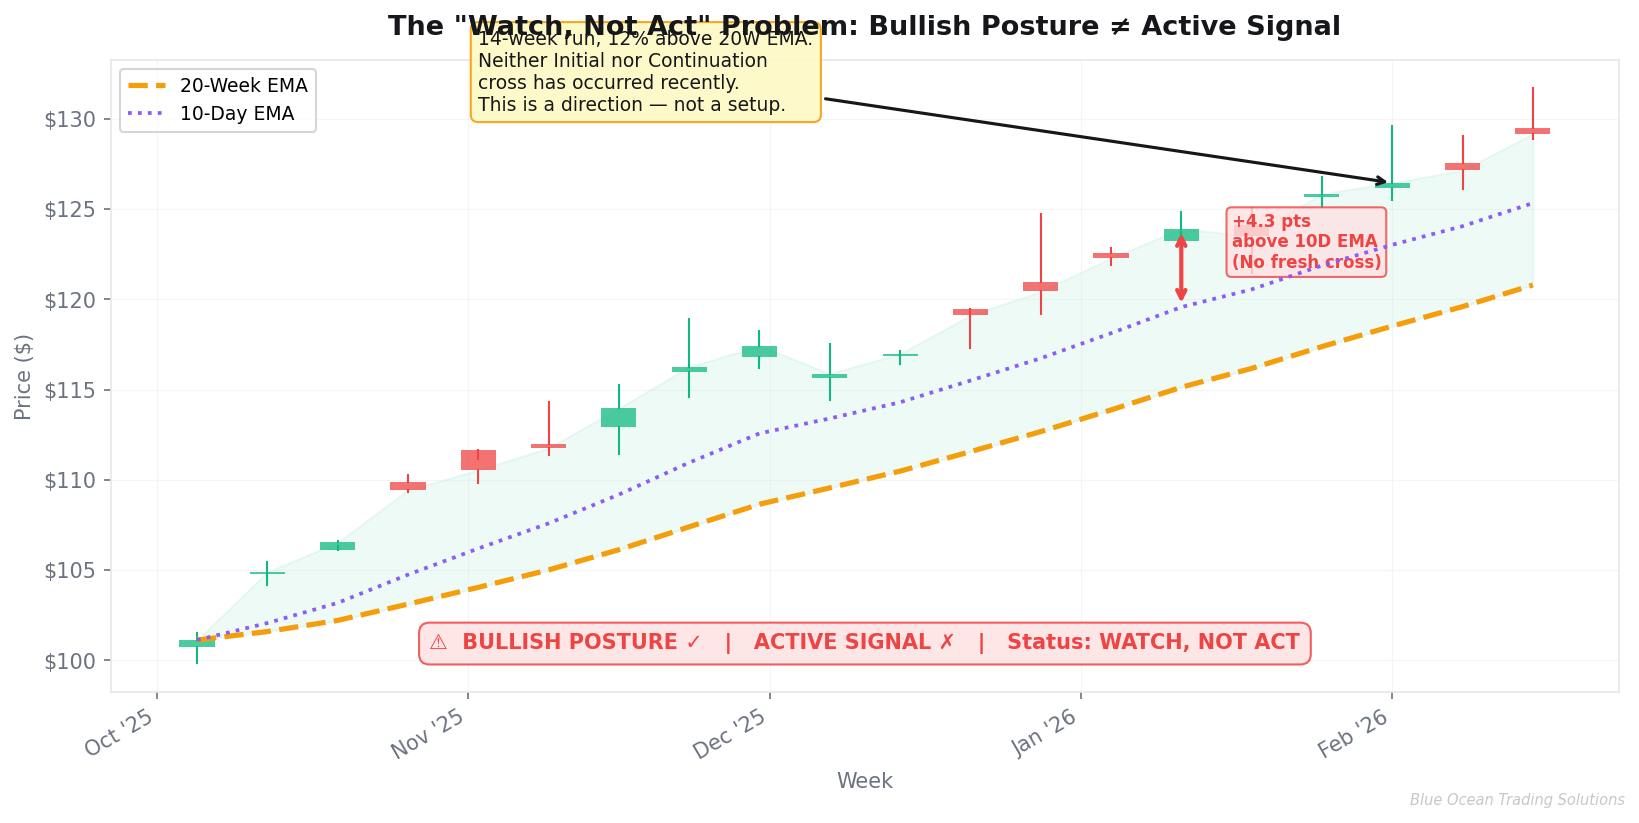
That situation is "watch, not act." The correct response is to put the asset on a watchlist with a specific trigger: "I want to see a pullback to the 10-day EMA followed by a fresh cross. When that happens, I'll evaluate the setup." Forcing an entry because the posture looks right — and the R:R calculates to something workable — is how traders get caught at the wrong part of a move.
The six questions the Trader's Eye asks before every setup:
- Where in the move is this? A fresh cross at the beginning of a trend has very different characteristics than an entry 14 weeks into a run that's 12% extended.
- What is the macro backdrop for this specific asset? Energy stocks behave differently on the day of a ceasefire announcement. Gold reacts to dollar strength in ways that can override the technical setup overnight.
- Why is this setup available right now? If the R:R looks unusually attractive, ask what the market knows that the framework doesn't.
- Is the stop defensible? A stop inside normal daily range gets hit before the thesis can be tested. The stop should mark the level where the idea is genuinely wrong — not where the noise is.
- What does volume say? A breakout on 40% of average volume is not a breakout. A breakdown on 2x volume is a different animal entirely.
- If you had to defend this to a skeptical trader, what would you say? If the honest answer is thin, the setup is thin.
The best setups have compelling answers to all six questions. They have a fresh cross, clean chart structure, a catalyst or context that supports the direction, a stop at a level that makes sense, and volume confirming the move. When those elements align, act with conviction. When they don't, the framework is telling you to wait.
7. Targets, Stops, and the Minimum Threshold
The mechanical rules for risk management are straightforward:
Target: The nearest weekly swing in the direction of the trade. For longs, the nearest weekly swing high above the entry price. For shorts, the nearest weekly swing low below. "Nearest" means closest to the entry — not the most distant level you could theoretically reach. If there is meaningful overhead supply between the entry and the theoretical target, that supply is your realistic target, not the textbook level beyond it.
Stop: The nearest daily swing on the opposite side of the trade. For longs, the nearest confirmed daily swing low below the entry. For shorts, the nearest daily swing high above. The stop should be at a level where, if price reaches it, the thesis is genuinely invalidated — not just tested by normal intraday noise.
Minimum R:R: 1.5:1. Below that threshold, the setup does not meet the standard, regardless of how good the direction feels. A 1.5:1 setup means you make at least $1.50 for every $1.00 you risk. Over a large sample of setups, this threshold keeps a system alive even with a win rate below 50%.
Key Insight: Targets Are Reference Points, Not Guarantees
If conditions deteriorate — the 10-day EMA crosses against the trade on the daily, volume dries up on a continuation attempt, a macro event changes the landscape — early exit takes priority over holding to the target. The target is where you aim. Risk management is what keeps you in the game long enough for targets to matter.
One nuance worth noting: the 2R fallback (doubling the risk distance as a target proxy) is a mechanical last resort, not a default. It exists for situations where a stock is genuinely in price discovery — where there are no prior weekly swing levels overhead because the asset is at all-time highs with no visible supply. In all other situations, use real levels. They're more honest, and they improve the quality of your setup evaluation.
8. Applying the Framework: A Practical Checklist
Before acting on any setup using the Two-Timeframe Edge, run through this sequence in order:
- State the 20-week EMA posture: bullish (above) or bearish (below).
- Apply the Golden Rule: direction must match posture. No exceptions.
- Identify the entry signal type: Initial (recent 20W cross) or Continuation (recent 10D cross in posture direction). If neither cross occurred in the last 1-2 bars, there is no active setup.
- Identify the target: nearest weekly swing in the direction of the trade.
- Identify the stop: nearest daily swing on the opposite side.
- Calculate R:R. If below 1.5:1, the setup doesn't qualify.
- Apply the Trader's Eye: Where in the move? What does the macro say? Is volume confirming? If the setup passes all six questions, act with conviction. If it doesn't, put it on watch with specific trigger criteria.
This is the service the framework provides: structure. Not certainty — markets don't offer certainty. Structure. A clear methodology for identifying which direction to trade, when the entry is valid, where the risk is defined, and when the conditions don't warrant action. The traders who do this consistently over time build a sustainable edge. The traders who skip steps — who act on posture alone, or who ignore the timing of the cross, or who force setups because the R:R "calculates" — tend to find out the hard way why the checklist exists.
9. Key Takeaways
- The 20-week EMA defines the weekly posture: bullish (above) or bearish (below). This determines which direction you trade — only longs in bullish posture, only shorts in bearish posture.
- The Golden Rule is inviolable: never trade against the higher-timeframe bias. A rally in a bearish-posture asset is a setup against you, not a buy signal.
- Entry signals require a recent cross — within the last 1-2 bars. Initial = fresh 20W EMA cross. Continuation = fresh 10D EMA cross in direction of posture. Stale setups are not setups.
- A bullish posture with no fresh cross is a direction, not a trade idea. The correct response is to watch, define the trigger, and wait for the cross to come to you.
- Targets go at the nearest weekly swing. Stops go at the nearest daily swing on the opposite side. Minimum 1.5:1 R:R — below that, pass.
- The Trader's Eye runs on top of the framework. Check where you are in the move, what the macro backdrop implies, what volume is saying, and whether you can make a genuinely compelling case for the setup. If you can't, the framework told you the structure. The eye tells you whether it's worth acting on.
This concept is central to everything we do at Blue Ocean. If you want to see the full system in action — posture maps, signal identification, and real trade setups with defined risk levels — the Two-Timeframe Edge is the framework that drives our daily research. Paid members get our trade ideas, entries, targets, stops, and R:R on setups like these — every trading morning before the bell, in the Pre-Market Brief.
Disclaimer: This report is for informational and educational purposes only and does not constitute investment advice, a solicitation, or a recommendation to buy or sell any security. All analysis is based on publicly available data and technical observations. Past performance is not indicative of future results. Trading involves substantial risk of loss. Always conduct your own due diligence and consult a qualified financial advisor before making investment decisions. Blue Ocean Trading Solutions and its analysts may hold positions in securities discussed.