Crude Oil Volatility: Using ATR to Size Risk When the Tape Gets Loud
A practical ATR-based framework for trading crude oil volatility: how to size positions, place volatility-consistent stops, and avoid getting whipsawed when energy markets re-price.

1) Why crude oil volatility matters right now

Sophia Marquez
Commodities & Macro Analyst · Blue Ocean Trading Solutions
Crude oil doesn’t whisper; it tends to broadcast. And when volatility rises, the usual retail habit of using the same position size and the same stop distance is how a manageable idea turns into an unmanaged outcome.
In the last six months, USO (a liquid WTI proxy) printed a largest one-day high-to-low range of roughly $25.60 on 2026-03-09, closing near $104.33. That’s a tape reminder that the risk unit in energy is not stable.
Today’s broader U.S. tape is being characterized as uncertain, which is usually another way of saying “headline-driven” and “positioning-sensitive.” In those environments, commodities can gap, reverse, and trend in the same week.
Key Insight
In crude, your edge might come from direction — but your survival comes from calibrating position size to volatility.
2) ATR explained: the cleanest volatility proxy most traders underuse
Average True Range (ATR) is a volatility measure that answers a simple question: how far does this market typically travel in a day? For crude, that question is non-negotiable because the driver set (geopolitics, supply disruptions, inventory surprises, FX) can re-price the curve quickly.
Conceptually, true range looks at the largest of three numbers for each session: the day’s high-low range, the distance from yesterday’s close to today’s high, and the distance from yesterday’s close to today’s low. ATR is just the moving average of that true range (commonly 14 periods).
Here’s the professional framing: ATR is not a signal. It is a risk thermostat. You can trade your preferred setup — trend continuation, mean reversion, breakouts — but ATR should inform how wide your stop is and how large your position can be.
Common misconceptions about ATR
- “ATR tells me where price is going.” It doesn’t. ATR only tells you how far price has been moving. Direction still comes from your setup and your market thesis.
- “Higher ATR means higher opportunity.” Sometimes. But in crude, higher ATR also means you can be stopped out faster, slippage matters more, and leverage becomes unforgiving.
- “ATR-based stops fix bad entries.” They don’t. They just keep the stop distance aligned with the market’s typical movement. If your entry has no edge, ATR will faithfully help you lose money at a consistent rate.
One useful mental model: ATR is the minimum viable unit of noise. If you place stops inside that noise, you’re asking the market to be quieter than it has been.
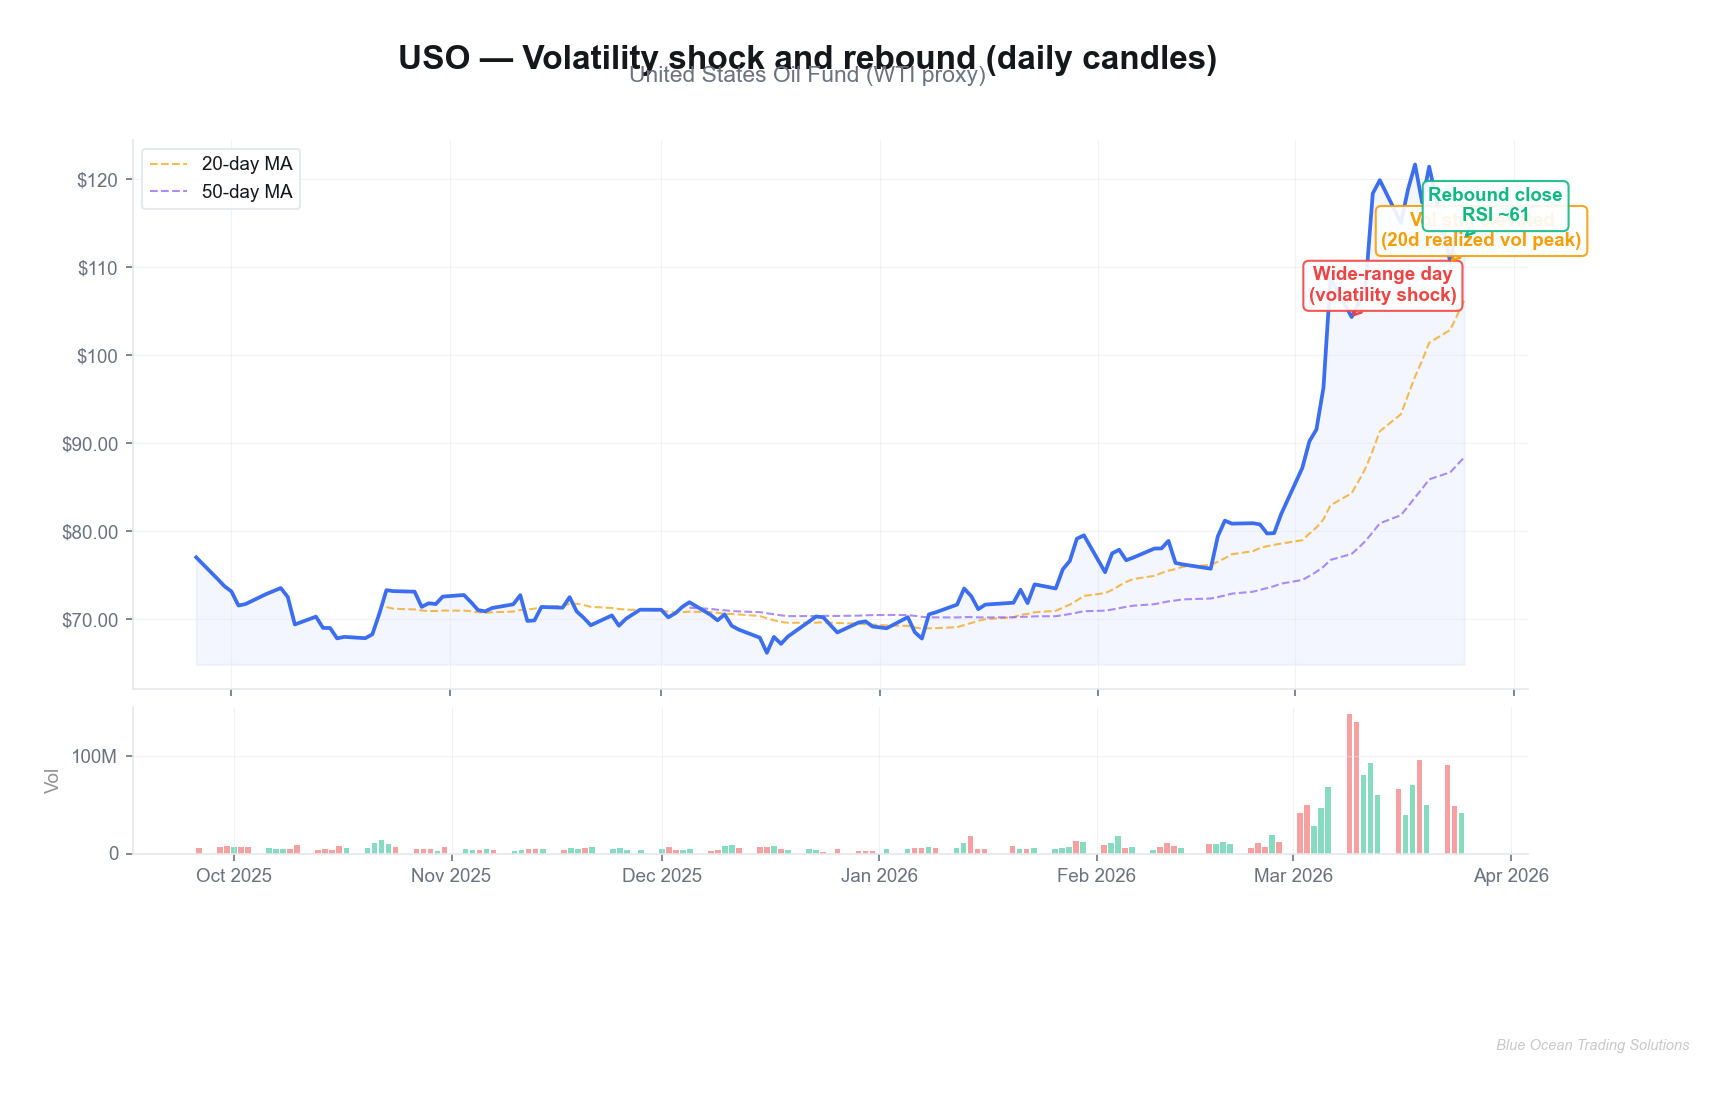
3) Real-world implementation: ATR sizing and stop architecture (USO case study)
Let’s keep it grounded in actual prints. Over the last six months, USO experienced a volatility surge into late March. The 20-day realized volatility (annualized) peaked around 2026-03-23 near 0.78. That’s not a small change in “weather”; it’s a different climate.
When volatility shocks like that show up, three mechanical adjustments matter:
- Size down: If ATR doubles, an unchanged position size doubles your dollar risk.
- Stop logic shifts: A fixed $ stop can become meaningless. Many systematic traders reference stops as a multiple of ATR (for example, 1.0× to 2.0× ATR) to avoid being “right” but stopped anyway.
- Timeframe selection: Intraday noise expands first. If you must trade, many traders move up a timeframe and accept fewer, cleaner decisions.
Now the nuance: ATR-based stops are not “looser stops.” They’re volatility-consistent stops. The point is to keep your probability of being stopped by noise reasonably stable across regimes.
What does a volatility-consistent stop look like?
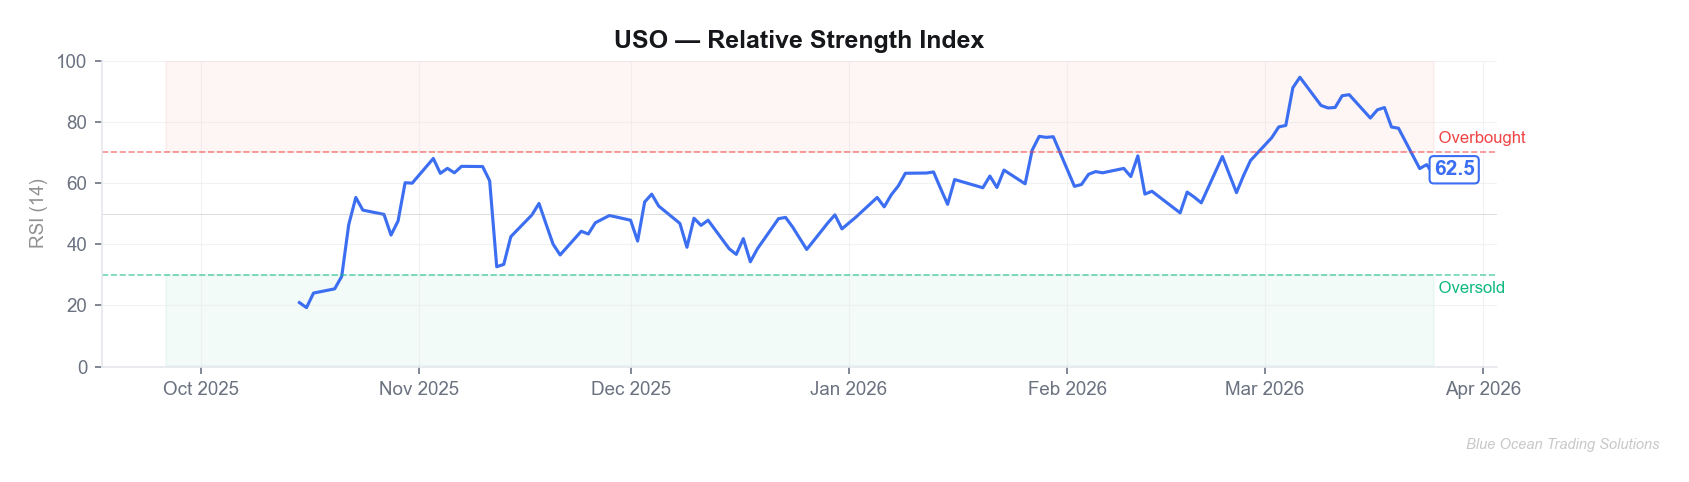
On 2026-03-25, USO closed near $113.39 with a 14-day ATR around $9.65 and RSI-14 near 61.1. An ATR-multiple stop approach might reference distances like 0.8×ATR, 1.2×ATR, or 1.8×ATR depending on timeframe and setup.
That translates into a dollar stop distance. Your job is then to back into position size so that your predefined risk (for example, a fixed fraction of account equity) stays fixed.
Two ways traders operationalize ATR (trend and mean reversion)
Trend continuation traders often use ATR to avoid getting shaken out during pullbacks. The idea is not “give it room” in the abstract — it’s to define “room” in a way that scales with regime. If ATR is elevated, they may accept fewer trades and require tighter structure (clear higher lows / lower highs) before committing risk.
Mean reversion traders often do the opposite: they use ATR to define how far is “far enough.” In crude, a move of one ATR is normal; two ATRs is where you start paying attention. That doesn’t mean you fade it blindly — it means you investigate whether the move is a liquidity event (often reversible) or information (often persistent).
Practical heuristic: In crude, treat 1×ATR as “routine travel,” 2×ATR as “attention,” and 3×ATR as “something broke.” The labels are imperfect, but they’re better than guessing.
4) Risk management integration: the “ATR budget” approach
In macro-sensitive markets, the most consistent risk process is the one that survives the ugly weeks. I prefer thinking in an ATR budget: how many ATRs am I willing to be wrong, and how many dollars does that represent?
A simple position-sizing template
- Define your maximum loss per trade (as a % of account equity).
- Choose a stop distance in ATR multiples that fits your setup and timeframe.
- Convert that ATR stop into dollars and compute position size:
position = risk_dollars / stop_dollars.
Where ATR fits in a commodity risk stack
ATR is one layer in a broader commodities risk stack. A clean process usually has:
- Volatility layer (ATR): sets the distance and the size.
- Liquidity layer: confirms you can enter/exit without turning your own slippage into the strategy.
- Event layer: scheduled releases and known risk windows.
- Correlation layer: energy equities, rates, USD, and broader risk sentiment can all matter — sometimes more than the last candle.
If you only do one thing after reading this article, do this: write down your standard stop distance and then rewrite it as an ATR multiple. If you can’t express it that way, your stop is probably emotional rather than systematic.
Risk Warning
ATR expands fastest right after the market surprises you. If your process only “adjusts” after losses, you are always late. Build ATR into sizing before you press the button.
Also note the commodity-specific wrinkle: crude can gap. Stops are not guarantees — they are instructions. That’s why the sizing step matters more than the stop selection.
5) Advanced variations: adding macro context and relative strength filters
Once ATR is doing its job (risk calibration), you can enhance selection and timing with higher-level filters.
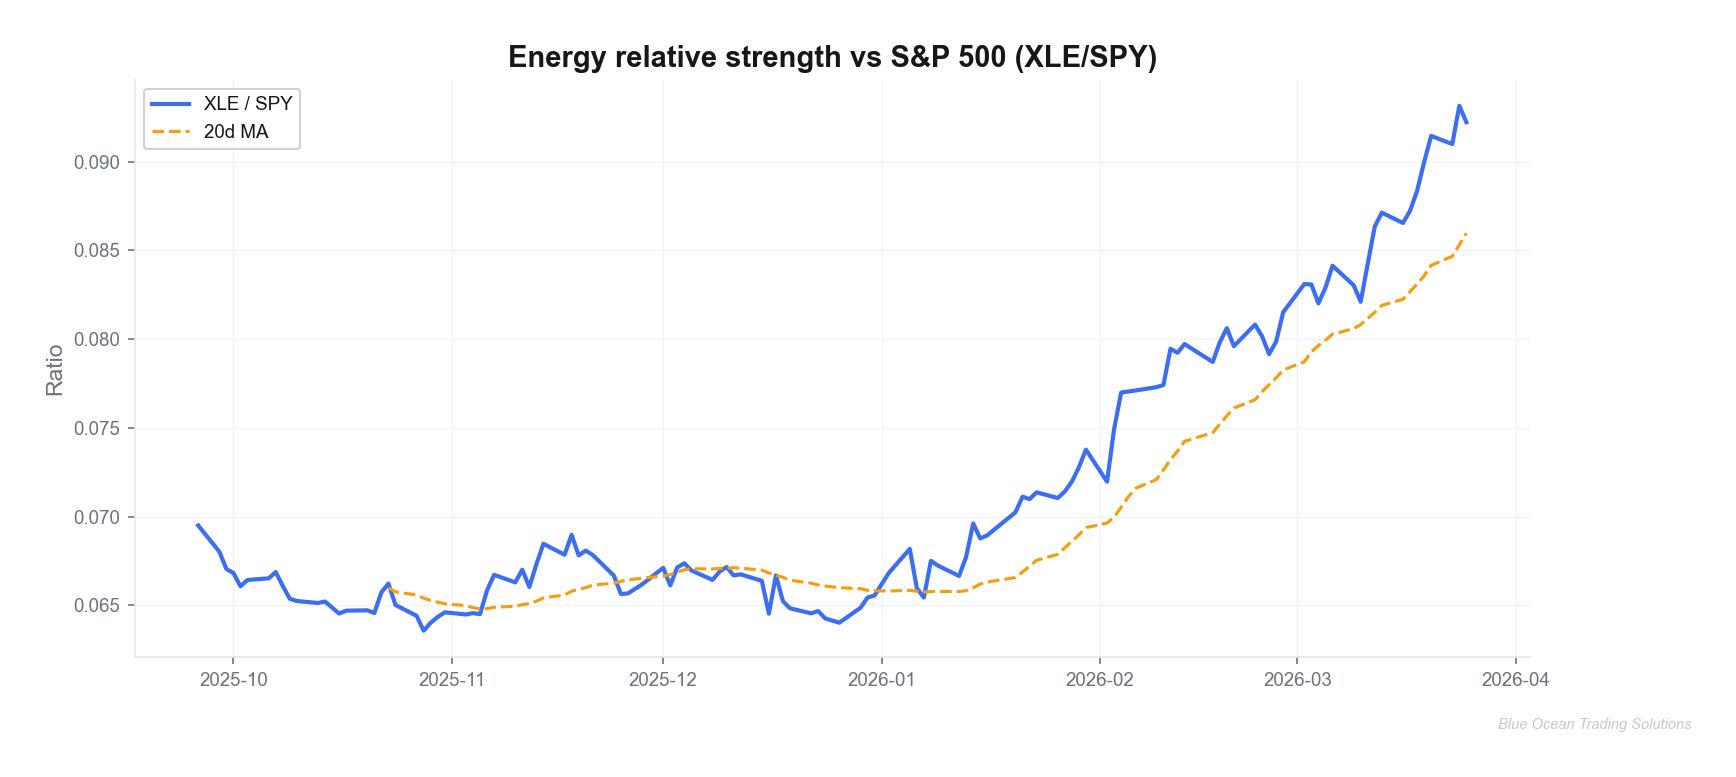
Relative strength: energy vs the broad tape
Energy’s behavior relative to the S&P 500 can hint at whether you’re trading a sector with tailwinds or fighting a headwind. Over the same six-month window, the XLE/SPY ratio is one quick way to frame that relationship.
Event risk: when to stand aside
Crude is uniquely sensitive to scheduled and unscheduled catalysts. Inventory data, OPEC communication, shipping disruptions, and geopolitical headlines can all change the distribution of returns. ATR rising into a known event is a hint that the options market and futures market are already paying for protection.
The advanced move isn’t to predict the catalyst; it’s to decide how much uncertainty you want to rent in your book.
Curve intuition (without needing a full derivatives desk)
Even if you never touch futures options, crude is still a curve market. What matters for spot and front-month behavior is not just the absolute price of oil, but where inventories are, how tight prompt supply is, and how the market is pricing forward availability. When that balance shifts, volatility often responds first.
For an education framework, you don’t need to model the curve. You just need to respect the implication: volatility clusters around information. ATR rising is the tape’s way of telling you information is arriving faster than usual.
6) Key takeaways
- ATR is a risk tool, not a directional tool. Use it to keep your sizing consistent across volatility regimes.
- Crude routinely shifts regimes — the largest one-day range in USO over the past six months was about $25.60.
- Volatility-consistent stops (ATR multiples) can reduce “noise stop-outs,” but only if you size down accordingly.
- Pair ATR with a momentum state tool (like RSI) and a context filter (like relative strength) for a more complete framework.
- The best risk decision in commodities is sometimes not trading when volatility is in shock mode.
If you want to practice this framework, start in a paper environment: pick one market, log ATR, and force yourself to size based on a fixed risk budget for four weeks. The goal is process consistency — the P&L can follow.
Blue Ocean Trading Solutions provides technical analysis and market research for educational purposes only. This content does not constitute investment advice, a recommendation, or a solicitation to buy or sell any security. All trading involves risk, including potential loss of principal. Past performance does not guarantee future results. Always conduct your own research and consult a licensed financial advisor before making investment decisions.