
Sector Rotation: Following the Money Through the Business Cycle
A professional framework for sector rotation trading — how to follow institutional money through the business cycle using sector ETFs, with real-world examples and risk management.

Something shifted in the rotation picture over the past six months — and if you missed it, the performance spread tells the story clearly. While XLK (Technology) and SPY (S&P 500) have largely tracked each other, both posting modest gains in the 3–4% range since September, XLE (Energy) has been diverging aggressively — up nearly 25% over the same period. That divergence is not noise. It is a textbook late-cycle rotation signal, the kind of systematic sector move that the business cycle framework is specifically designed to capture.

Marcus Chen
ETF & Sector Strategist · Blue Ocean Trading Solutions
For traders who think in terms of relative strength and factor rotation, the last six months have been a masterclass in following institutional money. When we decompose the flows, we see exactly what the cycle predicts: capital rotating out of high-growth, rate-sensitive sectors and into commodity-linked, inflation-beneficiary names. Understanding why that happens — and how to position ahead of it — is the core skill in sector rotation strategy.
The Business Cycle Sector Rotation Model
The business cycle sector rotation framework is one of the most durable analytical tools in institutional trading. The core insight is simple: different sectors of the economy have fundamentally different sensitivities to economic conditions, and as the economy moves through its recurring phases, capital flows predictably from one sector cluster to the next.
The model identifies four primary phases, each with its own sector leadership hierarchy:
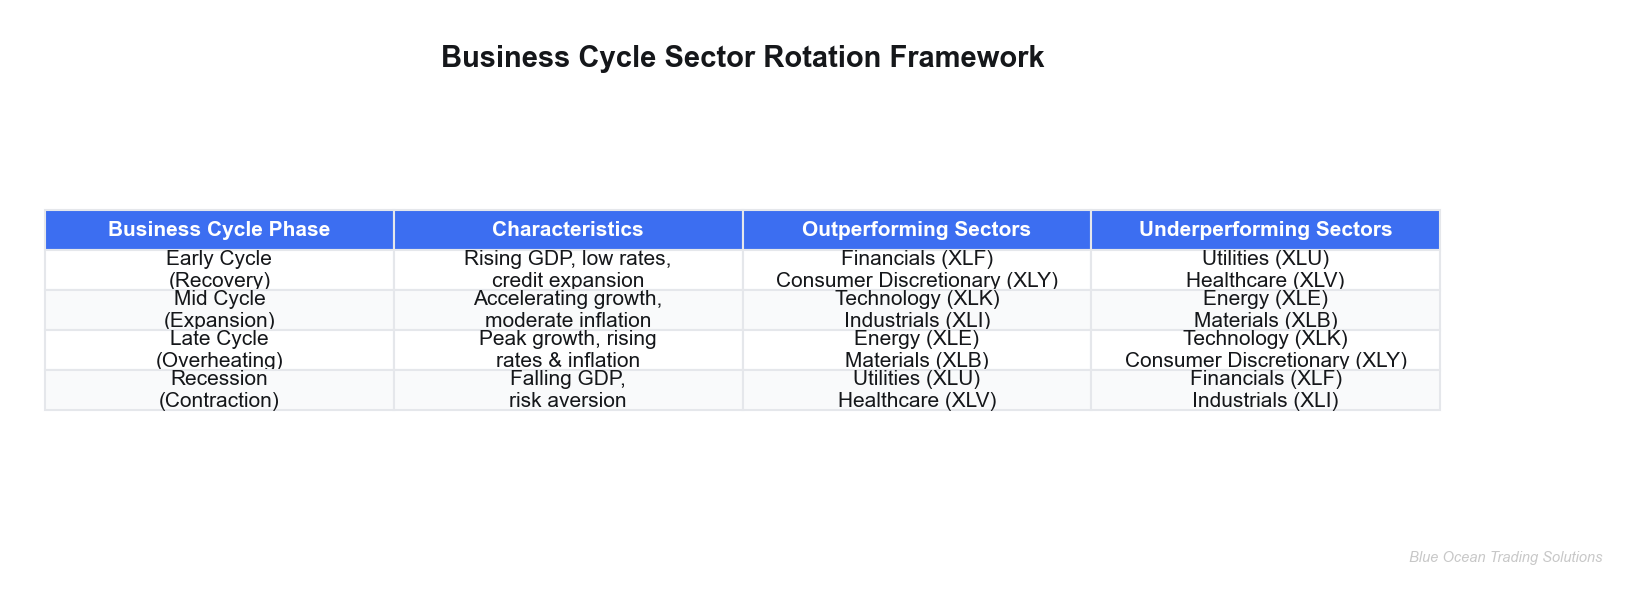
In the early cycle (recovery phase), the economy is emerging from contraction. Credit conditions ease, consumers begin spending again, and financial companies — who profit from loan growth and wider spreads — see earnings inflect first. XLF (Financials) and consumer discretionary names typically lead. Defensive sectors like utilities and healthcare, which were safe harbors during the recession, underperform as investors rotate back into risk.
The mid cycle (expansion phase) is generally the longest phase. GDP growth is healthy, corporate earnings are rising, and technology companies — which tend to have high earnings leverage to economic growth — outpace the broader market. XLK has historically dominated mid-cycle periods, driven by earnings acceleration and multiple expansion. This is also when XLI (Industrials) tends to perform, as capital spending picks up.
As the cycle matures into the late cycle (overheating phase), the picture rotates again. Inflation is rising, the central bank is tightening, and companies with hard assets and commodity exposure start outpacing growth names. XLE (Energy) and XLB (Materials) lead. Technology, which benefited from low rates, faces multiple compression pressure. This is the rotation we've been watching play out.
Finally, recession phase brings a flight to quality: utilities (XLU) and healthcare (XLV) become the favored shelters, offering predictable cash flows and lower correlation to economic activity.
Key Insight
Sector rotation is not about predicting the future — it's about reading the present. The cycle always telegraphs where we are through price action and relative strength. When XLE begins outpacing SPY consistently on both absolute and relative terms, the market is telling you late-cycle conditions are being priced in.
Real-World Rotation: What the Data Shows
Let's look at actual numbers. When we decompose the flows over the past six months, the XLK-vs-SPY relative performance chart paints a clear picture of a sector that has essentially tracked its benchmark with no meaningful alpha generation:
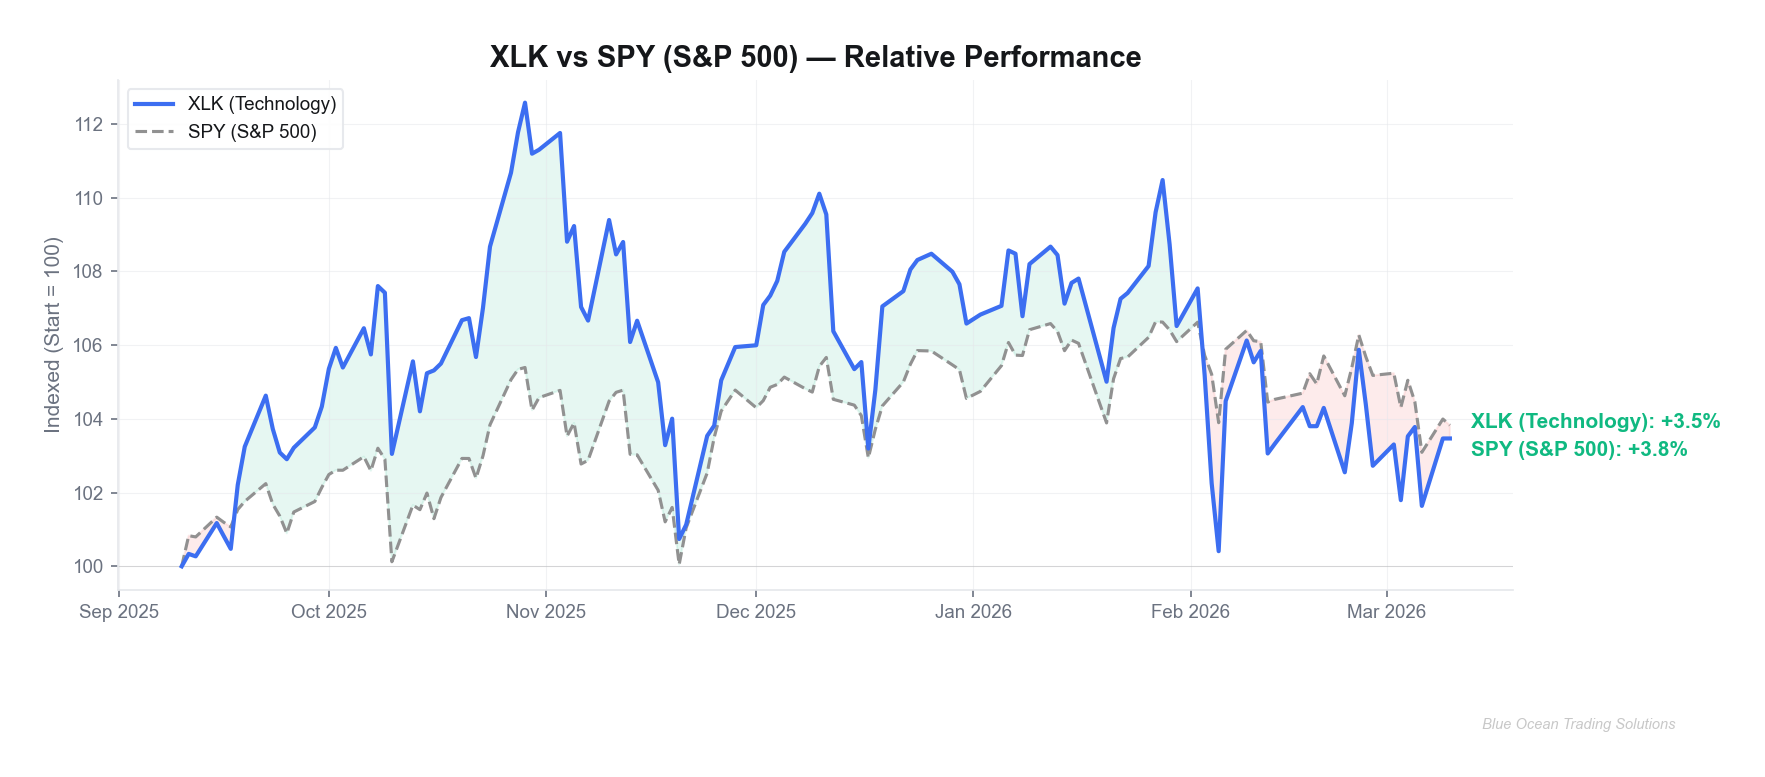
XLK began the period at $135.08, and today trades near $139.76 — a gain of roughly 3.5% relative to the benchmark. That is not the profile of a sector leading a bull run; it is the profile of a sector running in place. Mid-cycle leadership has effectively ended for technology, at least on a relative-strength basis.
Now contrast that with what XLE has done. Energy began the period near $44.56 and has climbed to approximately $55.60 — a gain of nearly 25% over the same six months. The divergence between XLK and XLE is exactly what the rotation model predicts when a cycle is transitioning from mid to late phase. Capital is being redirected, and the annotated chart below shows where the rotation picture first became actionable:
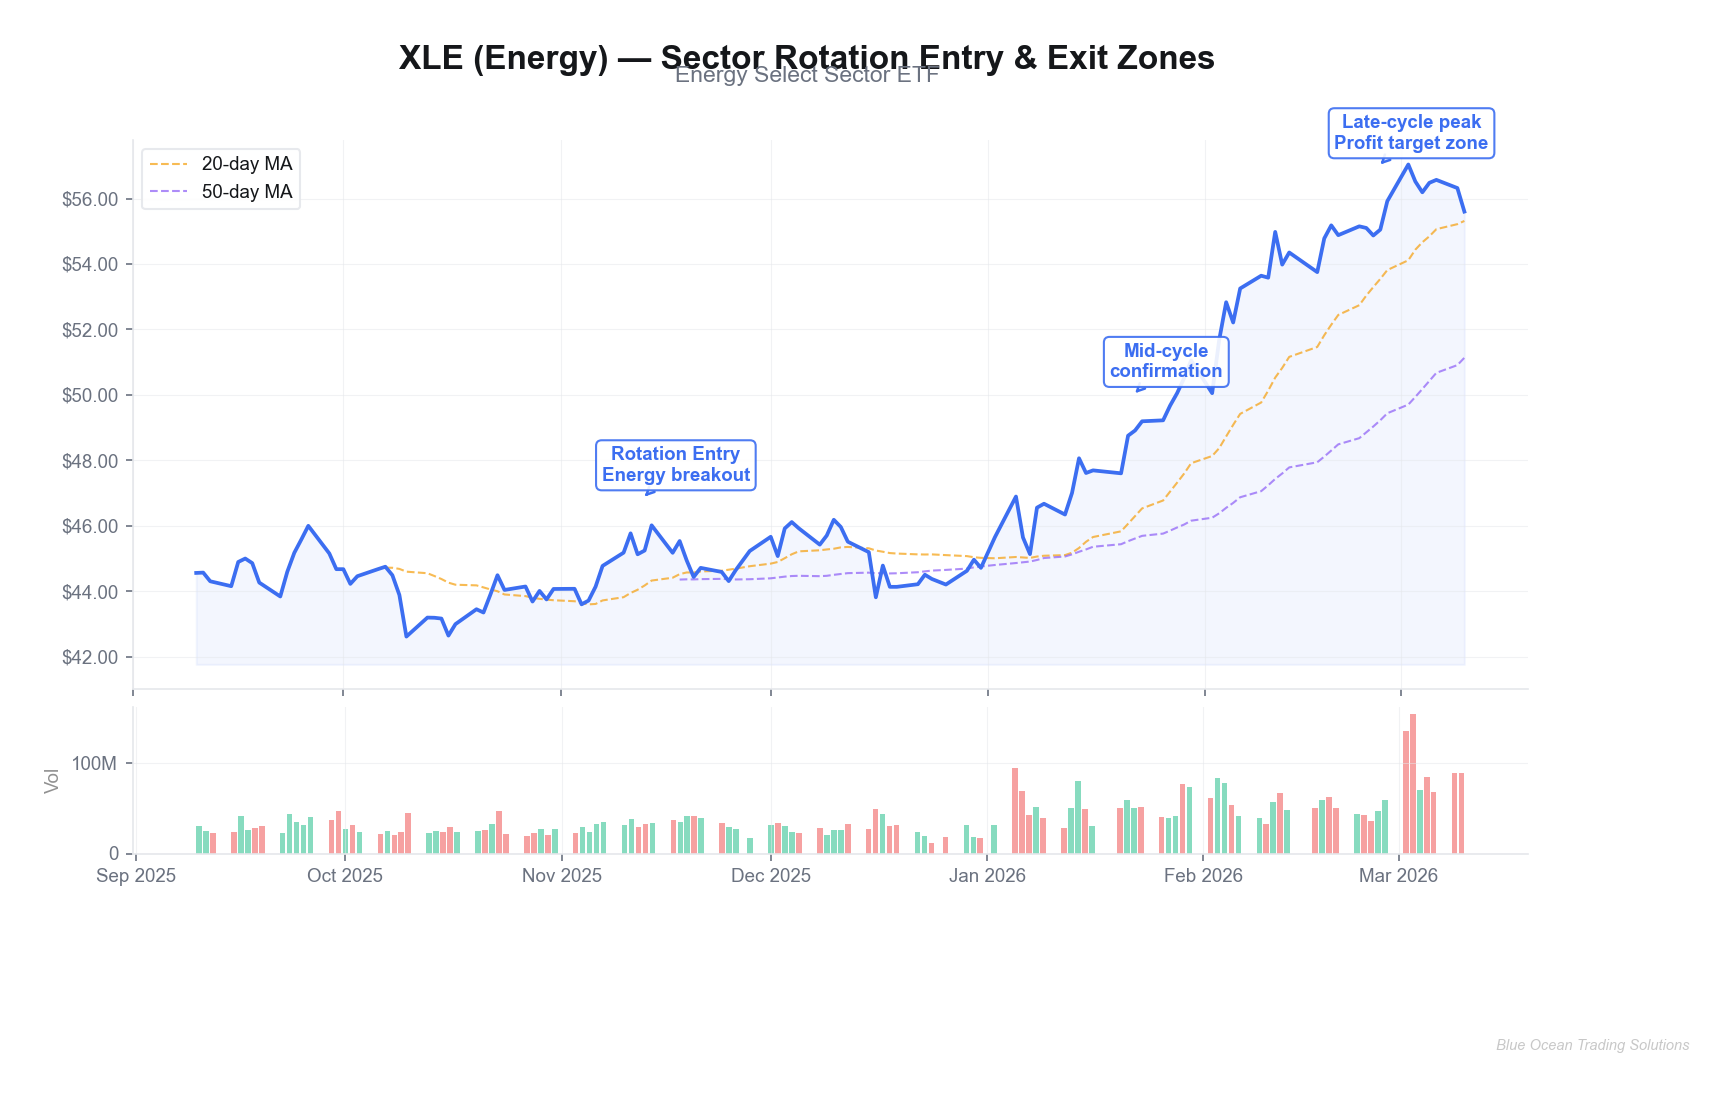
The entry signal in mid-November — when XLE broke decisively above the $46.50 consolidation range on elevated volume — was the rotation picture's first clear tell. By late January, the move had confirmed with XLE crossing $50. The late-cycle peak zone near $57 in late February represented a logical profit target window for traders who had positioned early in the rotation.
Key Insight
Current conditions show XLE near $55.60 with XLU (Utilities) beginning to firm. When we decompose the flows into defensive sectors alongside elevated energy prices, the data suggests the market is beginning to price in late-cycle risk — watch for XLU and XLV relative strength as a potential early signal of the next rotation phase.
Risk Management Integration
Sector rotation trades carry a specific and often underappreciated risk profile: they are relative-strength bets, not absolute-return bets. A sector can outperform its benchmark and still lose money in a broad market selloff. Managing this distinction is the difference between a rotation framework that generates consistent results and one that delivers occasional big wins offset by unexpected drawdowns.
Several principles apply across rotation strategies:
Position sizing must account for sector correlation. If you own XLE and XLK simultaneously, you are not as diversified as you might think. Both are positively correlated to the broader market. A meaningful selloff in SPY will pull both down. True rotation positioning means reducing exposure in lagging sectors and redeploying into leading ones — not simply accumulating positions across all sectors.
Define your rotation thesis invalidation levels before entering. In the XLE trade described above, the breakout entry near $46.50 meant the invalidation level was a decisive close back below that consolidation range. A close below $44–$45 would have indicated the breakout was a failed move, not a rotation confirmation. Having that level defined in advance removes emotional decision-making from the exit process.
Risk Warning
Sector rotation signals can give false reads, particularly during macro shock events. The COVID-19 selloff in early 2020 invalidated every rotation framework simultaneously as all sectors declined in tandem. Rotation strategies should always be sized with the understanding that tail events can override cycle positioning entirely. A hard stop loss on each position, not just a thesis invalidation, is non-negotiable risk management.
Monitor flows, not just price. Sector ETF volume patterns are a key confirmation signal. When XLE is breaking out on three to four times average daily volume — as it did in late November when 94 million shares traded versus an average of approximately 52 million — that is institutional-scale repositioning. Price moves on low volume are far more suspect as rotation signals. Always cross-reference price action with volume data before sizing up.
Beware of late-cycle overstay. The most common rotation mistake is holding a late-cycle sector position too long. XLE near $57 in late February was generating strong P&L, but the late-cycle peak zone was clearly identified on the cycle framework. Momentum can carry sectors beyond fundamental fair value, but rotation from late-cycle to defensive (recession-phase) sectors can happen quickly when the catalyst appears — typically a Fed policy inflection or a deteriorating employment print.
Advanced Rotation Variations
The basic four-phase model is a strong foundation, but professional rotation strategies introduce additional analytical layers that improve both timing and conviction:
Factor-based rotation overlays. Rather than treating sectors as monolithic blocs, factor analysis decomposes sector returns into underlying drivers — value, quality, momentum, low-volatility. When you identify that XLE's outperformance is driven by value factor expansion (rising earnings estimates combined with modest valuations) rather than pure momentum, you have more confidence in the sustainability of the move. Factor exposure analysis also helps identify when a rotation trade is running out of fuel: if value factor contribution to XLE's return starts fading while momentum contribution spikes, the trade may be in its final stage.
Relative strength ranking systems. A systematic approach ranks all 11 S&P sectors by their trailing 12-week and 26-week relative strength versus SPY, then overweights the top two or three sectors and underweights the bottom two or three. This removes the subjectivity of cycle-phase identification and replaces it with price-based signal. The ranking is updated weekly. When XLE moved from a middle-tier ranking in October to the top ranking by December, the mechanical system generated a strong overweight signal that aligned with the cycle analysis.
Momentum-adjusted rotation triggers. Pure cycle analysis can be slow to signal phase transitions. Combining cycle phase identification with momentum signals — specifically, the 13-week minus 26-week price momentum ratio — provides earlier and more actionable triggers. When XLE's short-term momentum crossed above its long-term momentum in mid-November, closing the gap that had existed since August, that crossover was the technical confirmation that the rotation picture had shifted decisively.
Cross-sector spread monitoring. Tracking the XLE/XLK ratio (Energy relative to Technology) provides a clean visual of the dominant rotation theme. When this ratio breaks above a multi-month base — as it did in November — it confirms that institutional capital is actively repositioning between these two sectors. The ratio chart often telegraphs the rotation three to four weeks before the individual sector price moves become obvious to less-systematic observers.
Key Takeaways
- The business cycle framework identifies predictable sector leadership sequences — early cycle favors Financials, mid-cycle favors Technology, late cycle favors Energy and Materials, and recession phase favors Utilities and Healthcare.
- Current data shows a textbook late-cycle rotation in progress: XLE has gained approximately 25% in six months while XLK has merely tracked SPY's 3–4% return, a divergence that reflects fundamental factor rotation rather than random price action.
- Entry signals should be confirmed by both price breakout and volume expansion — the November XLE breakout on 94 million shares (vs. 52M average) was a textbook institutional rotation signal.
- Invalidation levels must be defined at entry, not after a position has moved against you. For breakout-based rotation entries, a decisive close back below the breakout level serves as the primary exit trigger.
- Advanced overlays — factor analysis, relative strength rankings, momentum crossovers — improve both the timing and conviction of rotation trades by adding multiple independent confirmation signals.
- Rotation strategies are not absolute-return bets. Always size positions to survive a broad market shock, and never assume that outperformance relative to SPY protects against drawdown in a systemic selloff.
Blue Ocean Trading Solutions provides technical analysis and market research for educational purposes only. This content does not constitute investment advice, a recommendation, or a solicitation to buy or sell any security. All trading involves risk, including potential loss of principal. Past performance does not guarantee future results. Always conduct your own research and consult a licensed financial advisor before making investment decisions.