
USO – Technical Market Research
Comprehensive technical analysis of USO covering price action, momentum, fundamental context, and the macro backdrop.
Published March 8, 2026 | Commodity (Crude Oil) | USO

Sophia Marquez
Commodities & Macro Analyst · Blue Ocean Trading Solutions
Technical Overview
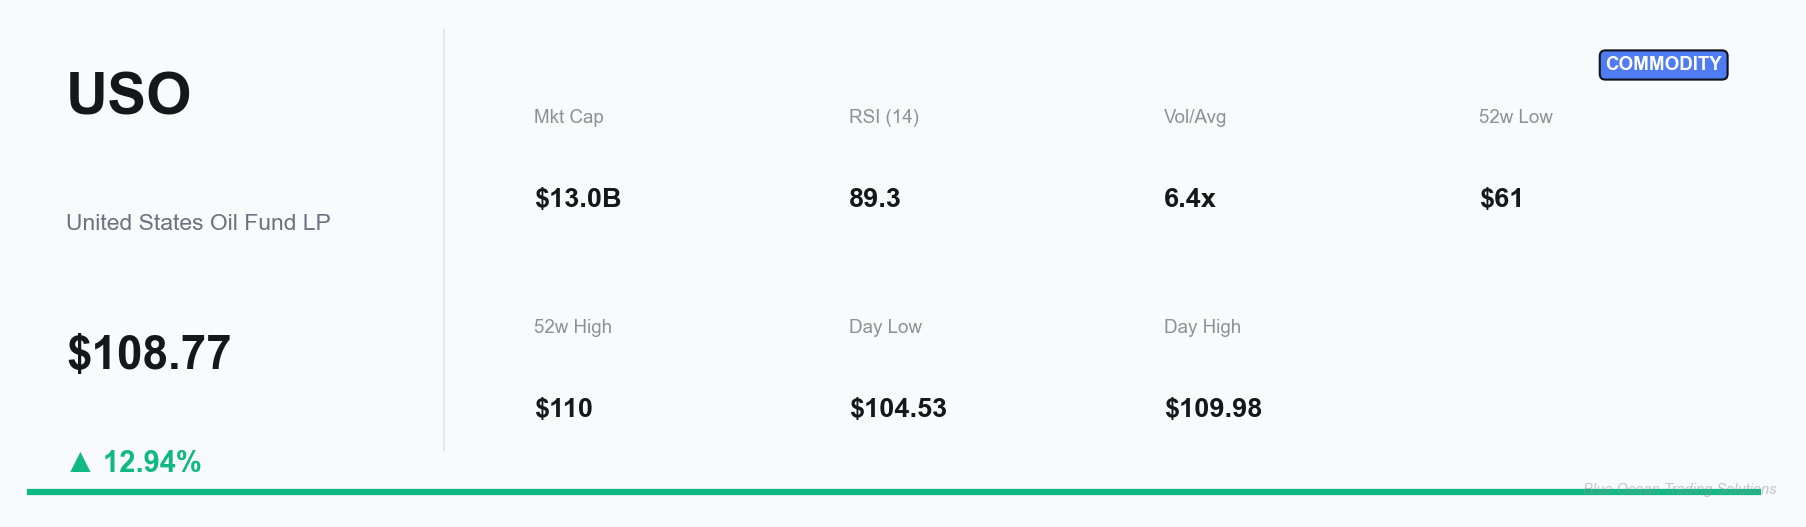
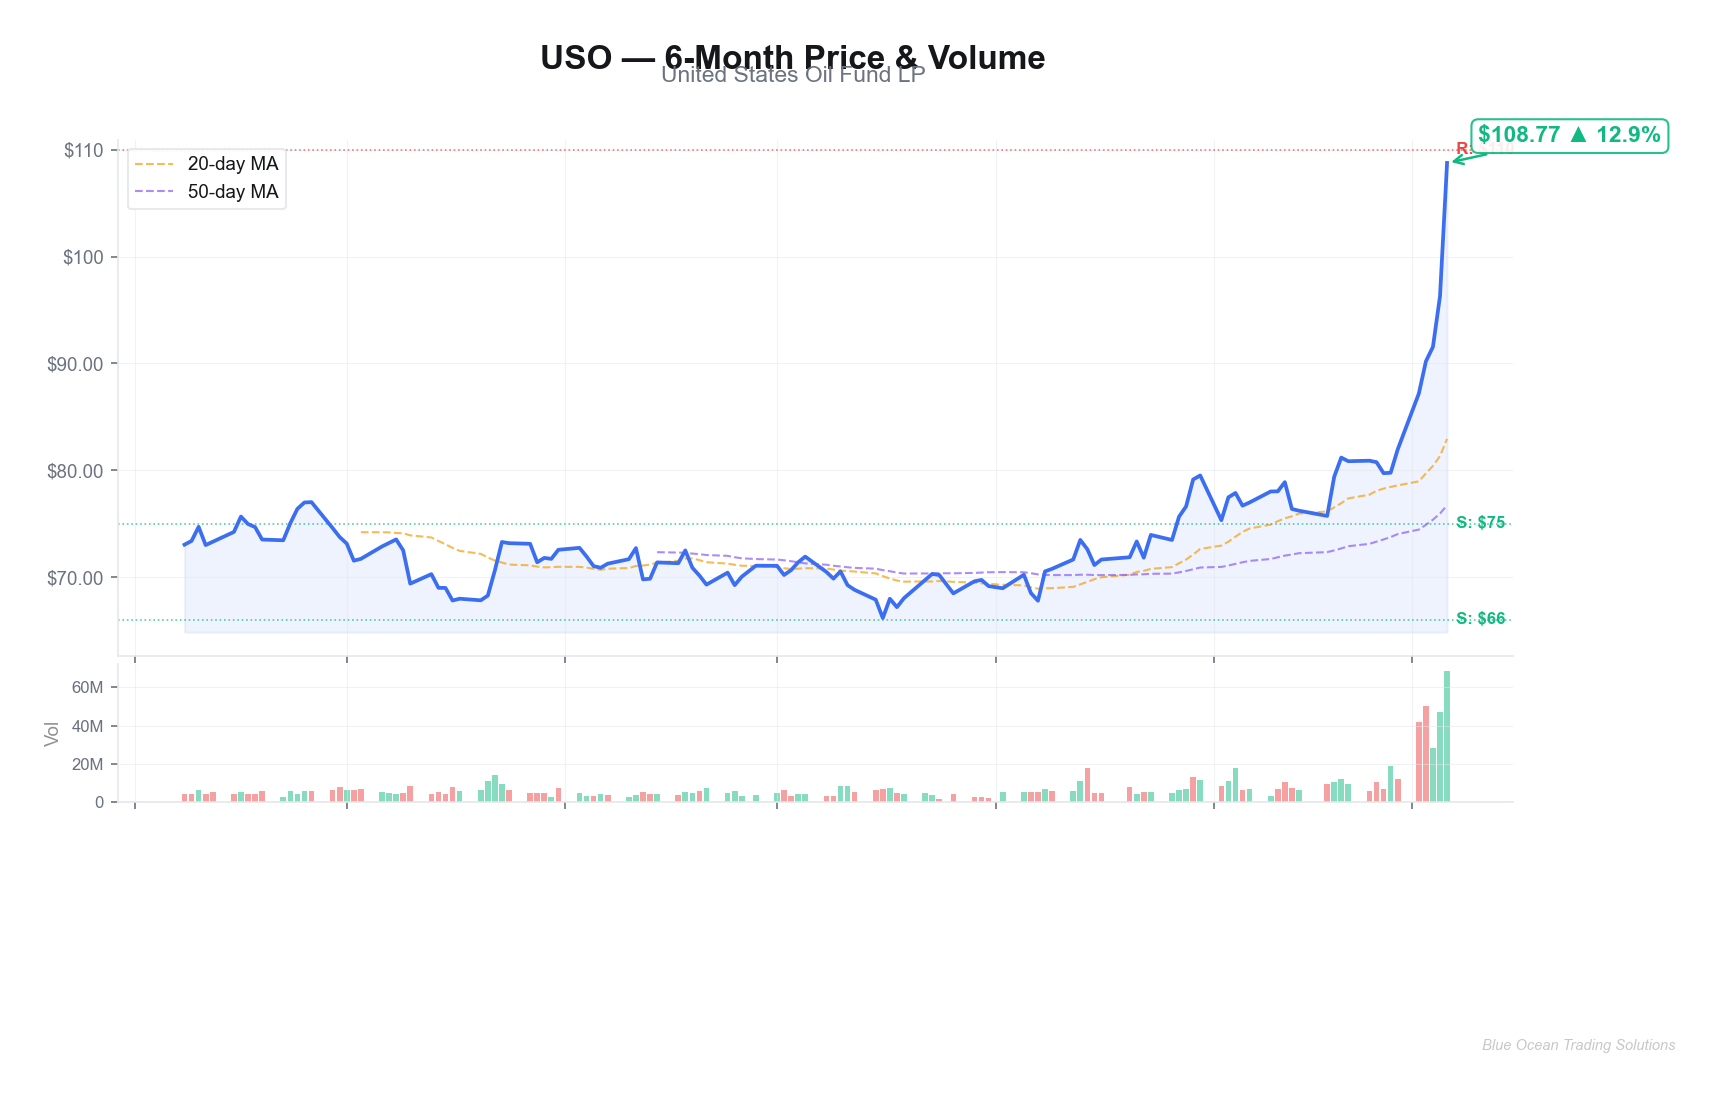
The United States Oil Fund (USO) has undergone a seismic technical transformation over the past two weeks. After spending nearly four months consolidating in a $66–$78 range from October through late February, the fund erupted higher following the onset of the US-Israeli military strikes on Iran on February 28. The resulting price action represents one of the most aggressive moves in USO's recent history, with the fund gaining approximately 49% from its December low of $66.17 to Friday's close of $108.77.
The move is characterized by a near-vertical ascent with expanding volume. Friday's session alone saw 68 million shares change hands — more than 6.4 times the average daily volume of roughly 10.6 million shares. This volume surge confirms the conviction behind the move, though it also raises the question of whether late-arriving participants are chasing an already-extended rally.
From a moving average perspective, USO has completely separated from both its 20-day and 50-day moving averages. The 20-day MA sits roughly in the low-$80s, well below current price. This degree of separation from trend-following indicators is unusual and historically tends to resolve with either a sharp pullback or an extended period of sideways consolidation to allow the averages to catch up.
The candle structure over the past five sessions tells a story of escalating urgency: Monday opened with a gap up to $87.62, Tuesday saw aggressive selling into the close from $94 to $90, Wednesday stabilized and recovered to $91.56, Thursday gapped again to $94.46 and surged to close at $96.31, and Friday exploded with a $12+ move to close at $108.77 — touching a new 52-week high of $109.98 intraday.
Levels and Context
The directional bias is unambiguously bullish, driven by a genuine supply shock in the global oil market. However, the magnitude of the move and the momentum readings suggest an extended condition that historically precedes at least a short-term consolidation.
Key levels to observe:
- Resistance: $110 (the newly established 52-week high and the psychologically significant round number). Above that, $120–$125 comes into focus if the Strait of Hormuz disruption persists, reflecting the pricing regime observed during the 2022 energy crisis.
- Support: $96 (Thursday's close and a potential initial pullback target), $90 (the area of early-week consolidation that coincides with the WTI crude $90/bbl level), and $78–$80 (the pre-conflict consolidation highs and the 20-day moving average convergence zone).
- Invalidation of bullish structure: A close below $78 would suggest the geopolitical premium is dissipating faster than the market anticipated.
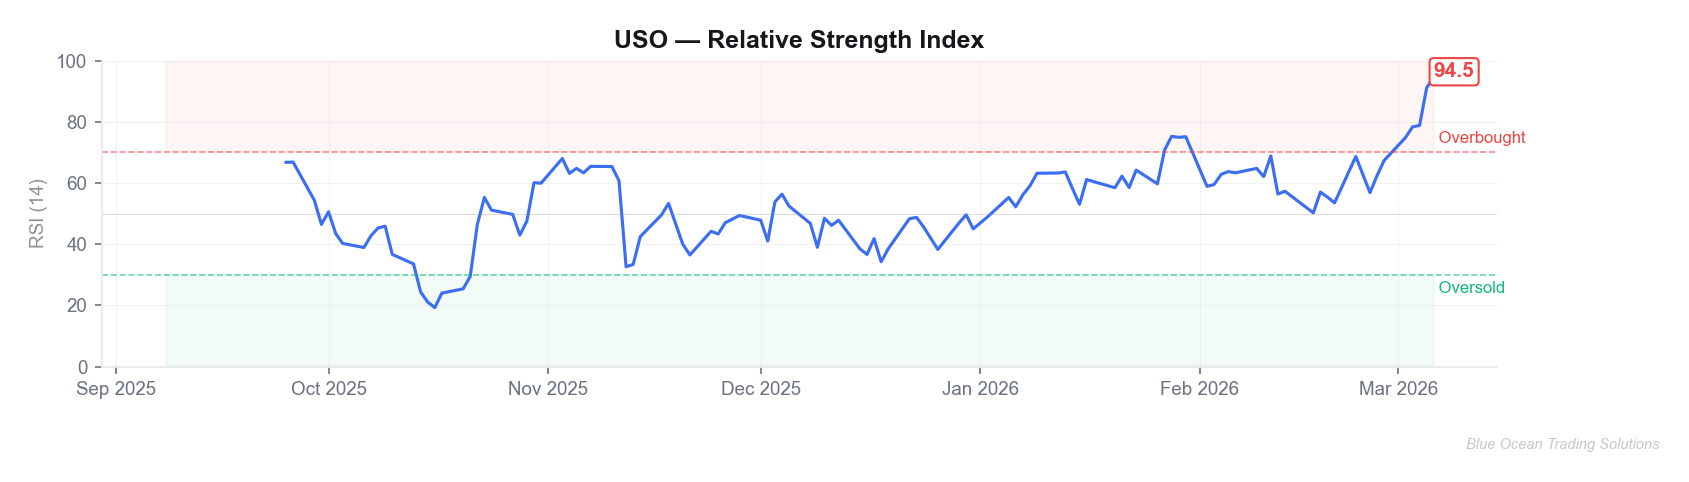
The 14-day RSI stands at 89.3 — deeply overbought by any standard. This reading is in the 99th percentile of USO's historical RSI distribution. While RSI can remain elevated during powerful trend moves, readings above 85 have historically preceded a mean-reversion episode within 5–10 trading sessions. The last comparable RSI reading occurred during the initial weeks of the Russia-Ukraine conflict in early 2022.
Commodity Snapshot
The United States Oil Fund (USO) is a commodity-linked ETF that seeks to track the daily price movements of West Texas Intermediate (WTI) light, sweet crude oil. Managed by United States Commodity Funds (USCF), the fund achieves its exposure primarily through front-month WTI futures contracts traded on the NYMEX. With approximately $13 billion in assets, USO is the most widely held crude oil ETF in the United States.
Supply-side dynamics have shifted dramatically. The Strait of Hormuz — through which approximately 20% of the world's oil supply transits daily — has been effectively shut down for over a week following the escalation of US-Israeli military operations against Iran. Iran's retaliatory posture has disrupted shipping lanes, and major OPEC producers including Iraq, the UAE, and Kuwait have been forced to curtail output as onshore storage capacity fills.
Prior to the conflict, OPEC+ had been managing a delicate supply balance. The group's December 2025 report forecast global demand for OPEC+ crude at 43 million bpd in 2026, roughly in line with then-current production. The IEA, however, had projected a surplus of up to 3.8 million bpd, driven by robust non-OPEC+ supply growth from the US, Brazil, and Guyana.
Demand-side factors remain supportive. OPEC's most recent Monthly Oil Market Report projected global oil demand growth of 1.4 mb/d year-over-year in 2026, led by non-OECD economies. The current supply shock overlays a market that was already tighter than the IEA's bearish forecasts had suggested, creating the conditions for the aggressive price response observed this week.
WTI crude closed Friday at approximately $90.90/bbl after surging over 35% for the week, while Brent crude exceeded $100/bbl for the first time since 2022. U.S. gasoline prices have risen 14% in the past week to $3.41/gallon, the highest since 2024.
News & Catalyst Context
The dominant catalyst is the US-Israeli military strike campaign against Iran, which began on February 28. The conflict has evolved rapidly over the past week:
- February 28: Coordinated US-Israeli strikes on Iranian military and nuclear targets initiated. Oil markets began to price in geopolitical risk immediately.
- Early March: Iran's retaliatory threats and attacks effectively closed the Strait of Hormuz to commercial shipping. Both sides have targeted energy infrastructure.
- March 6 (Friday): WTI crude surged $12 in a single nine-hour session, blasting past $92.50/bbl. Brent crude jumped 6.7% to $86.47 (intraday), with Sunday futures indicating prices above $110/bbl.
- March 8–9: Brent crude surged past $111/bbl in Sunday evening trading, up approximately 50% since the conflict began. The Strait remains effectively closed with no indication of imminent normalization.
U.S. oil producers are aggressively hedging at elevated prices, with record volumes of energy futures and options contracts traded on ICE during the first week of March. President Trump characterized the price spike as "short term," calling it a "very small price to pay for U.S.A., and World, Safety and Peace."
The key forward-looking question is the duration of the Strait of Hormuz disruption. If shipping normalizes within weeks, the geopolitical premium could unwind rapidly. If the closure extends for months, structurally higher oil prices — potentially $100–$120+/bbl — become the baseline scenario.
Macro & Cross-Asset Backdrop
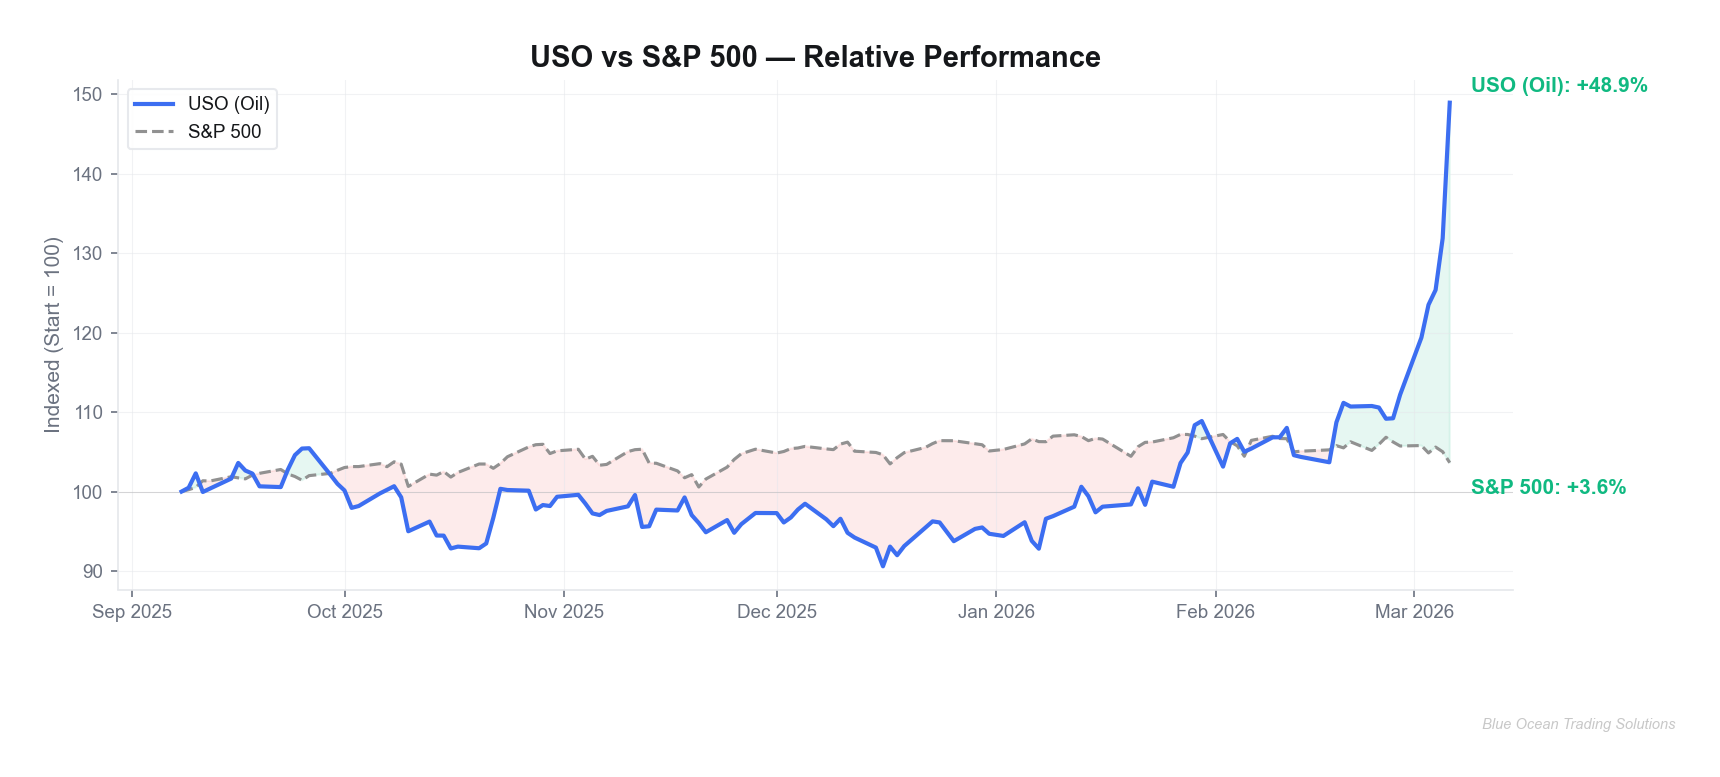
The oil spike is occurring against a backdrop of significant equity market stress. The S&P 500 (SPY) declined to $672.38 on Friday, down approximately 3.6% over the past week, as the energy shock compounds existing macro concerns. The divergence between USO and SPY has been stark: over the past six months, USO has returned approximately +49% while SPY has gained just 3.6%, representing a massive performance gap that underscores oil's role as a geopolitical risk barometer.
The energy price shock introduces a stagflationary dynamic into the macro picture. Higher oil prices feed directly into transportation, manufacturing, and consumer costs, threatening to reignite inflation at a time when the Federal Reserve has been signaling a data-dependent approach. If oil remains above $90–$100/bbl for an extended period, the market may need to reprice rate expectations and earnings forecasts simultaneously.
Historically, oil supply shocks of this magnitude have had asymmetric macro effects: the inflationary impulse arrives immediately (gas prices, diesel, petrochemicals), while the growth drag accumulates over quarters. The commodity is currently acting as a leading indicator of broader economic stress rather than a lagging reflection of demand strength.
In the commodity complex, gold (GLD) has also been rising, consistent with a flight-to-safety and inflation-hedging narrative. Silver (SLV) has shown a similar pattern. This broad commodity strength suggests the market is pricing in a sustained period of supply-side inflation rather than a one-time shock.
Synthesis
USO is in the grip of a powerful geopolitical supply shock that has overwhelmed all prior technical structures. The fund has surged nearly 49% from its December lows, driven by the near-complete closure of the Strait of Hormuz following the US-Israeli strikes on Iran. Volume has exploded to 6.4x the daily average, confirming the magnitude of repositioning occurring across the energy complex.
The technical picture presents a classic tension between trend strength and extension. The directional move is unambiguous and fundamentally supported by a genuine supply disruption, but the RSI reading of 89.3 represents an extreme that has historically preceded at least a short-term consolidation. The price is far above its 20-day and 50-day moving averages, creating a "rubber band" effect where mean-reversion pressure builds with each passing session.
The fundamental picture hinges almost entirely on the geopolitical timeline. If the Strait of Hormuz reopens relatively quickly, USO could retrace a significant portion of the geopolitical premium. If the disruption extends, the current price levels may represent a new baseline rather than a peak. OPEC+ production constraints, record producer hedging activity, and the downstream impact on gasoline and diesel prices all suggest the energy market is entering an abnormal regime that could persist for weeks or months.
From a cross-asset perspective, the oil spike's negative correlation with equities and positive correlation with gold creates a distinctive regime that suggests investors are positioning for sustained inflation and geopolitical uncertainty. USO's 6-month outperformance of SPY by roughly 45 percentage points reflects the commodity's emerging role as the primary barometer of Middle East conflict risk.
This research is for informational and educational purposes only. It does not constitute investment advice, a recommendation, or a solicitation to buy or sell any securities or digital assets. All analysis reflects technical and fundamental observations as of the publication date. Past performance is not indicative of future results. Always conduct your own due diligence and consult a licensed financial advisor before making investment decisions. Blue Ocean Trading Solutions and its contributors may hold positions in the assets discussed.


Comments ()