
QQQ – Technical Market Research
Comprehensive technical analysis of QQQ covering price action, momentum, fundamental context, and the macro backdrop.
Published March 8, 2026 | ETF | QQQ

Marcus Chen
ETF & Sector Strategist · Blue Ocean Trading Solutions
Technical Overview
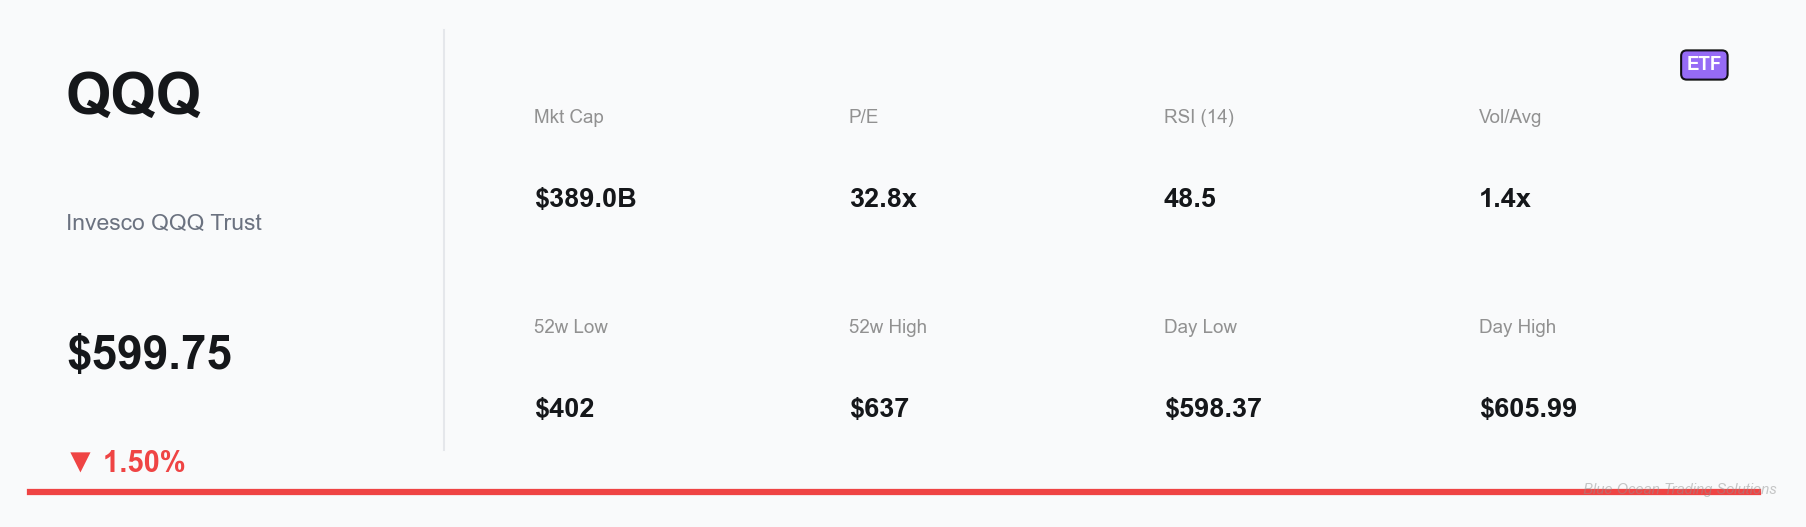
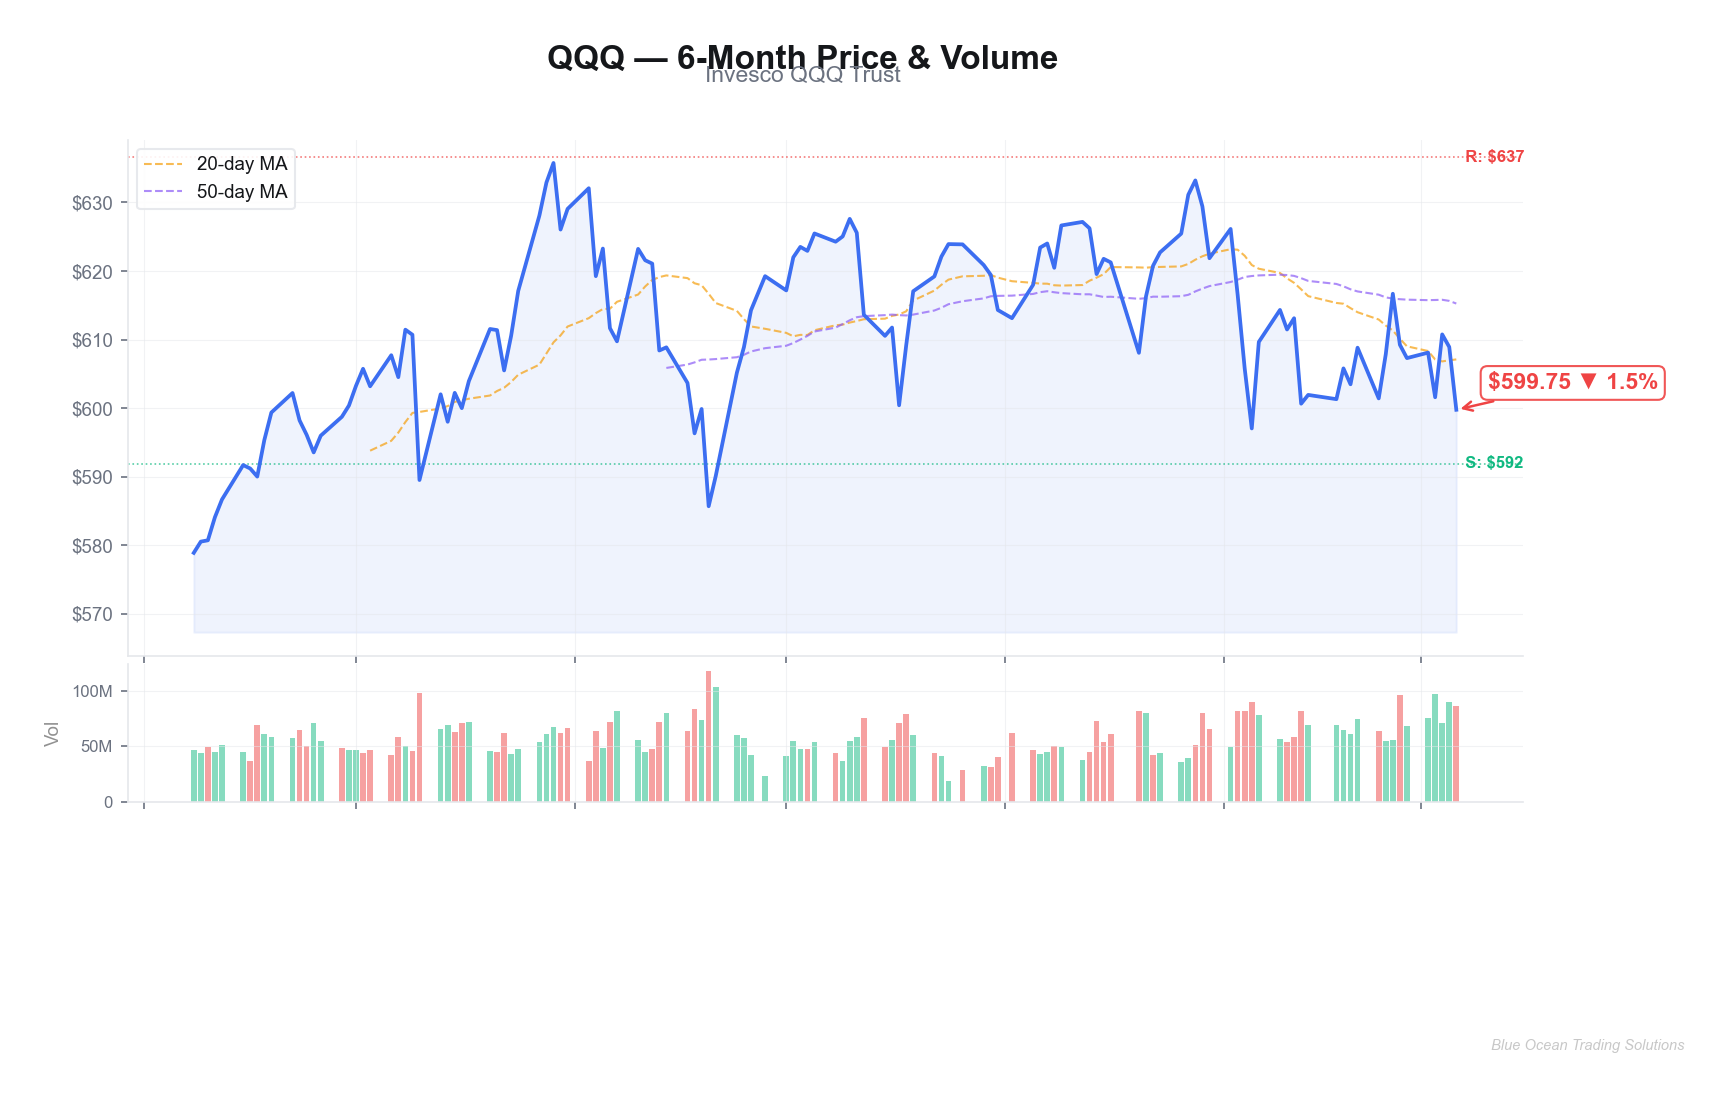
The Invesco QQQ Trust (QQQ), which tracks the Nasdaq-100 Index, closed at $599.75 on March 8, 2026, declining 1.50% on the session. Intraday action ranged from $598.37 to $605.99, reflecting a tight but directionally biased range consistent with a market in distribution. The ETF is pulling back from its 52-week high of $637.01 and currently sits approximately 5.8% below that peak, having declined from a structure that appeared to be consolidating for a potential new leg higher in late 2025.
The current price of $599.75 is testing the psychologically significant $600 level, which has served as both prior resistance and current support on the daily chart. A sustained close below $600 on elevated volume would represent a meaningful technical deterioration, as the round number carries significant institutional order clustering. The 52-week low of $402.39 places the current correction in broader context — the Nasdaq-100 has had an extraordinary 12-month run, gaining nearly 49% from its annual trough, and even a 10–15% corrective move from the highs would be within normal parameters of a healthy bull market pullback.
Moving average analysis reveals that QQQ has recently broken below its 20-day moving average and is approaching a test of the 50-day moving average. The 50-day MA is a critical level for the ETF — historically, QQQ's primary bull market phases have been characterized by price remaining above this average, while corrective phases see it acting as resistance on attempted recoveries. A clean break and hold below the 50-day would shift the intermediate-term technical picture toward caution.
Volume context is notable: today's session of approximately 86 million shares significantly exceeded the 60 million share average, indicating elevated selling pressure rather than a low-conviction pullback. Above-average volume on down days, particularly near key support levels, is a bearish technical signal that suggests institutional repositioning rather than routine profit-taking.
Breadth indicators within the Nasdaq-100 have deteriorated alongside price. The number of constituents trading above their 50-day moving averages has declined meaningfully over the past four weeks, suggesting the index-level pullback is broad-based rather than driven by a small number of mega-cap components. This internal weakness is consistent with a more durable corrective phase rather than a brief consolidation before the next advance.
Levels and Context
QQQ's technical structure as of March 8, 2026 places the ETF at a pivotal inflection point. The $598–$600 zone is the immediate battleground, with the psychological $600 level carrying substantial significance for both retail and institutional participants. The price action over the next several sessions around this level will be informative about whether the current pullback is a garden-variety consolidation or the early stage of a more meaningful corrective move.
Support levels: The $598–$600 area represents immediate support, bolstered by the round-number psychology and prior price interaction. Below that, the $580–$585 zone corresponds to a high-volume accumulation area from December 2025 and aligns with the 50-day moving average trajectory. The $560–$565 range represents a deeper support cluster where the ETF experienced extended consolidation before the final leg higher toward $637. The $540 area — corresponding to the 200-day moving average — represents major structural support and a level that would signal a significant trend change if tested.
Resistance levels: On the upside, the $610–$615 area is the first overhead resistance, representing the recent consolidation zone prior to the February breakdown. The $625–$630 band corresponds to prior distribution activity near the highs, and the all-time high of $637.01 remains the ultimate resistance unless new catalysts drive fresh demand into technology leadership names.
Invalidation: A recovery above $620 on strong volume would suggest the corrective move is concluding and would warrant a reassessment of the near-term bearish bias. Conversely, a daily close below $590 would accelerate momentum toward the $580 support zone and raise questions about the depth of the current correction.
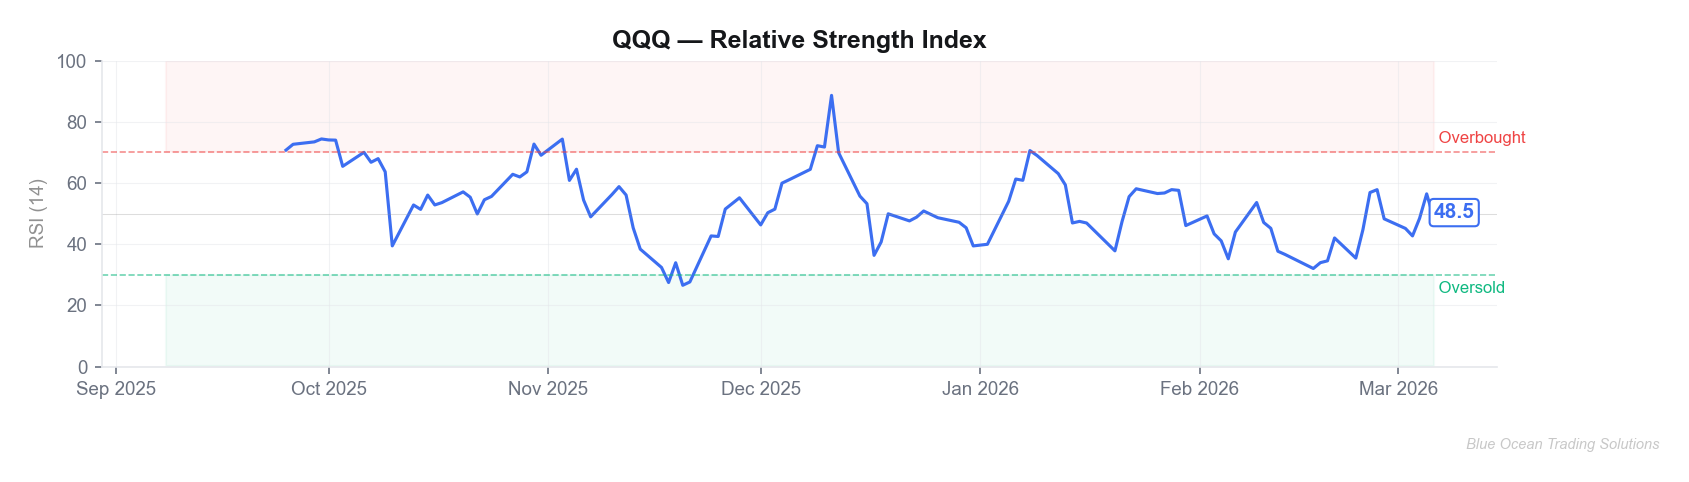
The RSI reading of approximately 45 places QQQ in neutral-to-weakening territory — below the 50 midline but not yet approaching the oversold threshold near 30. This reading is consistent with a mid-correction posture where additional downside is possible before momentum exhausts itself to the downside.
Fundamental Snapshot
The Invesco QQQ Trust is one of the most widely traded exchange-traded funds globally, offering exposure to the Nasdaq-100 Index — a modified market-cap-weighted index of the 100 largest non-financial companies listed on the Nasdaq Stock Market. The ETF's approximately $389 billion in assets under management makes it a critical barometer of institutional sentiment toward large-cap technology and growth equities.
The top holdings of the Nasdaq-100 are heavily concentrated in mega-cap technology names. As of early 2026, the index's top positions include Apple, Microsoft, NVIDIA, Amazon, Meta Platforms, Alphabet, Tesla, Broadcom, and several other high-profile technology and consumer internet companies. This concentration means QQQ's performance is heavily influenced by the fortunes of a relatively small number of companies, which amplifies both upside momentum and corrective moves.
At a current price-to-earnings ratio of 32.84x on an EPS basis of $18.26, QQQ trades at a premium to the broader S&P 500, reflecting the growth orientation of its underlying constituents. This premium is historically justified during periods of strong technology earnings growth, but becomes a vulnerability when growth expectations moderate or when interest rate dynamics shift in ways that disproportionately impact long-duration growth assets.
The sector composition of QQQ is tilted heavily toward information technology (~55%), communication services (~15%), and consumer discretionary (~13%), with minimal exposure to traditionally defensive sectors such as utilities, healthcare, or consumer staples. This composition makes QQQ highly sensitive to risk appetite cycles and particularly exposed to regulatory, competitive, and macroeconomic headwinds affecting the technology sector.
News & Catalyst Context
The technology sector — and by extension, QQQ — is navigating a complex news environment in early March 2026. The dominant narrative involves the interplay between AI-driven earnings expectations and the macro reality of a Federal Reserve that has shown less willingness to cut rates than markets anticipated at the start of the year. Several of QQQ's largest holdings have delivered strong recent earnings, but forward guidance from companies exposed to advertising markets and enterprise software has been mixed, raising questions about the durability of the 2025 earnings growth rates.
Regulatory risk remains an overhang for several large-cap technology names within the index. Ongoing scrutiny of AI products, cloud market concentration, and digital advertising practices from both domestic regulators and the European Commission has introduced event risk that is difficult to price into a passive ETF vehicle. Any adverse regulatory outcome for top-weighted holdings would ripple directly through QQQ's NAV.
On the catalyst front, the first quarter of 2026 earnings season — beginning in mid-April — will be a critical test of whether the premium valuations embedded in QQQ's top holdings are justified by revenue and earnings delivery. Analyst consensus currently calls for mid-teens earnings growth for the Nasdaq-100 in aggregate, and any broad miss against these expectations would likely accelerate the current technical correction.
Macro data releases, particularly inflation prints (CPI, PCE) and labor market data (NFP), will continue to shape Federal Reserve rate expectations and by extension, the discount rate applied to QQQ's long-duration earnings streams. Hotter-than-expected economic data that pushes out rate cut expectations has been a consistent source of headwinds for growth-oriented equities in early 2026.
Macro & Cross-Asset Backdrop
The macro environment in early 2026 presents a nuanced backdrop for technology-heavy equity vehicles like QQQ. The Federal Reserve's "higher for longer" posture — with fewer rate cuts priced in for 2026 than the market anticipated at year-end 2025 — has been the primary macro headwind. Rising real yields compress the present value of future earnings, and QQQ's constituents, with their elevated growth multiples and long-duration cash flow profiles, are among the most sensitive to this dynamic.
The U.S. dollar has remained relatively strong in this environment, creating mixed signals: a stronger dollar can weigh on the international revenues of QQQ's top multinational technology holdings (Apple, Microsoft, Alphabet), but also reflects the relative economic outperformance of the U.S. — a broadly positive backdrop for domestic earnings. The net effect has been a modest headwind rather than a significant fundamental negative.
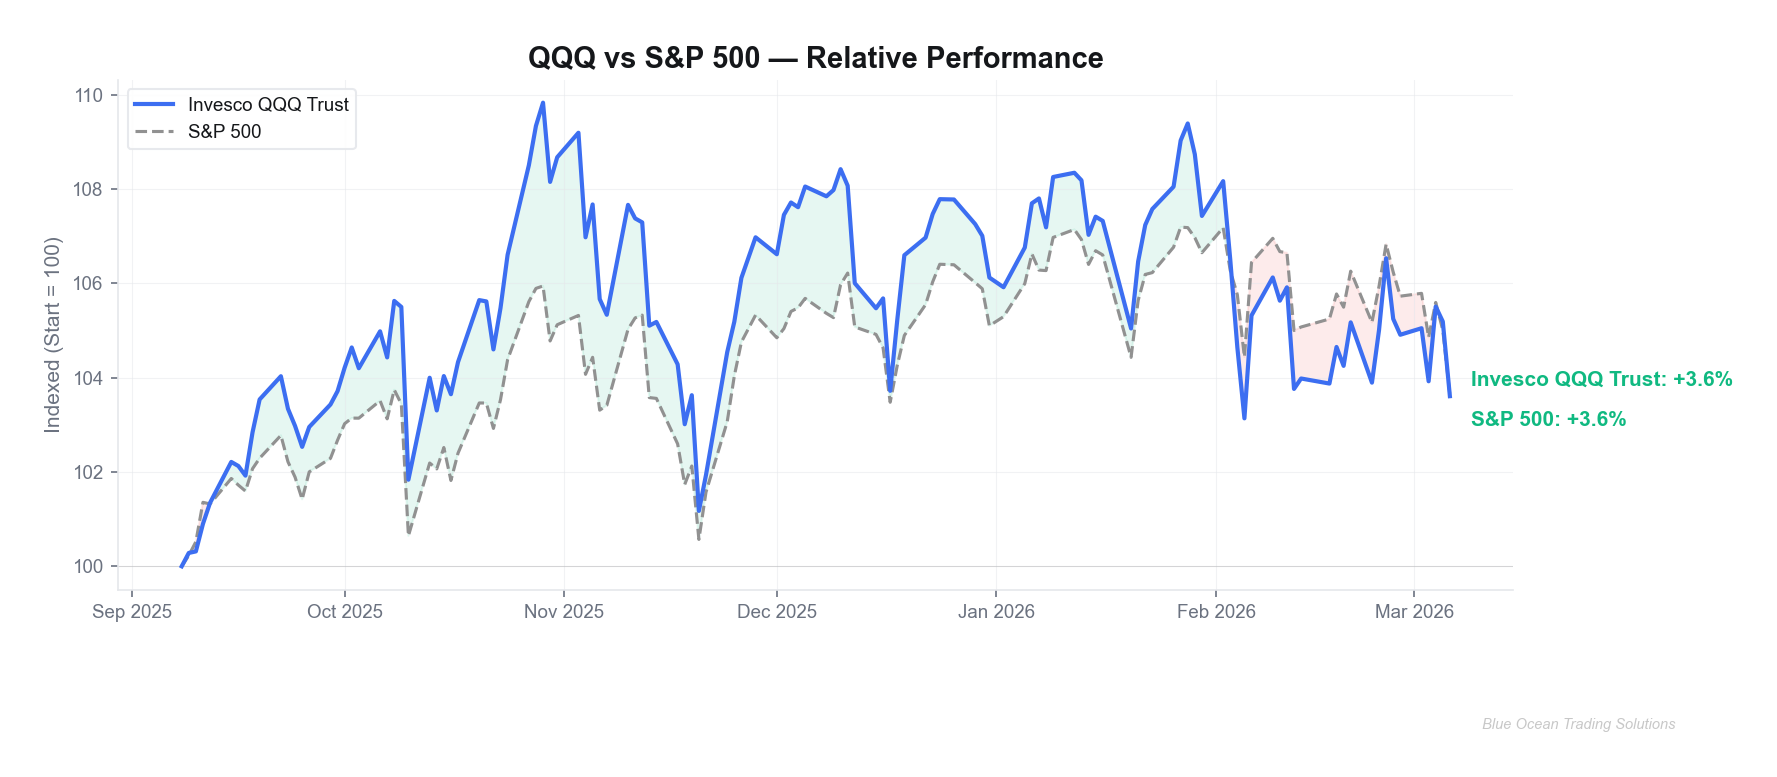
QQQ's performance relative to the S&P 500 has been negative over the past 30–60 days, reflecting the factor rotation from high-multiple growth toward value, dividends, and defensives that has been underway. This rotation is consistent with a late-cycle economic dynamic where investors prioritize capital preservation and income over speculative growth, though it is worth noting that such rotations can reverse quickly if economic data shifts or if the Fed pivots toward a more accommodative stance.
Cross-asset signals are mixed: credit spreads remain relatively contained, suggesting no systemic concerns, while the VIX has ticked modestly higher alongside the equity market pullback. Commodity markets are relatively stable, and there are no significant cross-asset dislocation signals that would imply a broader risk-off event is imminent. The current picture looks more like a technical consolidation within an intact longer-term uptrend than the beginning of a structural bear market for technology equities.
Synthesis
QQQ's technical and fundamental picture as of March 8, 2026 tells a story of a high-quality ETF in a healthy corrective phase following a substantial 2025 advance. The 5.8% pullback from all-time highs is well within historical norms for a Nasdaq-100 correction, and the longer-term structural bull market in technology innovation remains a durable fundamental backdrop.
However, the near-term technical indicators argue for caution. The break of the 20-day moving average, the above-average volume on the down day, the RSI reading below 50, and the test of the $600 psychological support level collectively paint a picture of a market that has not yet found its corrective bottom. The $580–$585 zone — where the 50-day moving average is likely to converge — appears to be the next meaningful technical destination if the $600 level fails to hold on a closing basis.
The fundamental backdrop is constructive on a medium-term horizon: QQQ's holdings continue to generate substantial free cash flow, maintain dominant market positions in their respective categories, and benefit from the secular tailwinds of AI adoption, cloud migration, and digital advertising growth. The P/E ratio of 32.84x is elevated but not extreme given the earnings growth profile of the underlying index.
The synthesis of technical caution and fundamental quality suggests the current environment rewards patience and observation over aggressive directional positioning. The convergence of the $580–$585 support zone with the 50-day moving average and a potential RSI oversold reading would represent the technical conditions most consistent with a durable corrective low, based on historical patterns in QQQ over prior corrective cycles.
This research is for informational and educational purposes only. It does not constitute investment advice, a recommendation, or a solicitation to buy or sell any securities or digital assets. All analysis reflects technical and fundamental observations as of the publication date. Past performance is not indicative of future results. Always conduct your own due diligence and consult a licensed financial advisor before making investment decisions. Blue Ocean Trading Solutions and its contributors may hold positions in the assets discussed.


Comments ()