
NVDA – Technical Market Research
Comprehensive technical analysis of NVDA covering price action, momentum, fundamental context, and the macro backdrop.
Published March 8, 2026 | Equity | NVDA

Rachel Kensington
Senior Equity Analyst · Blue Ocean Trading Solutions
Technical Overview
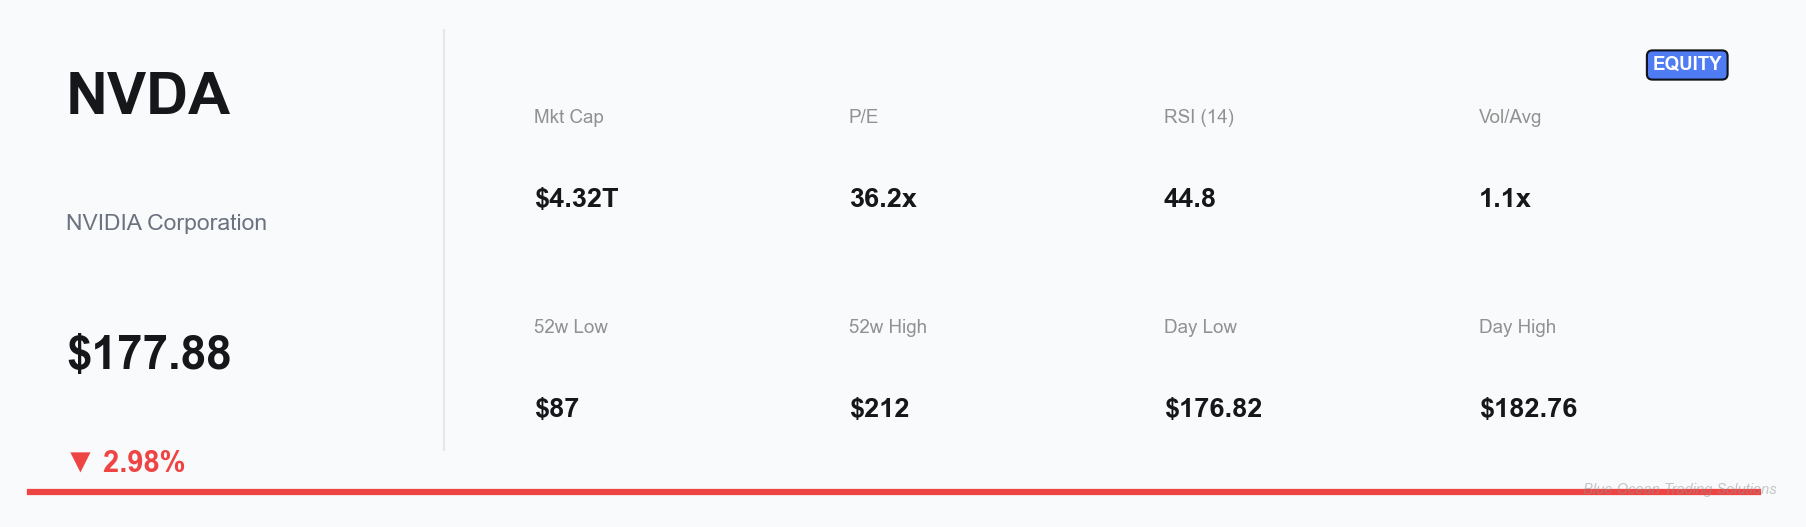
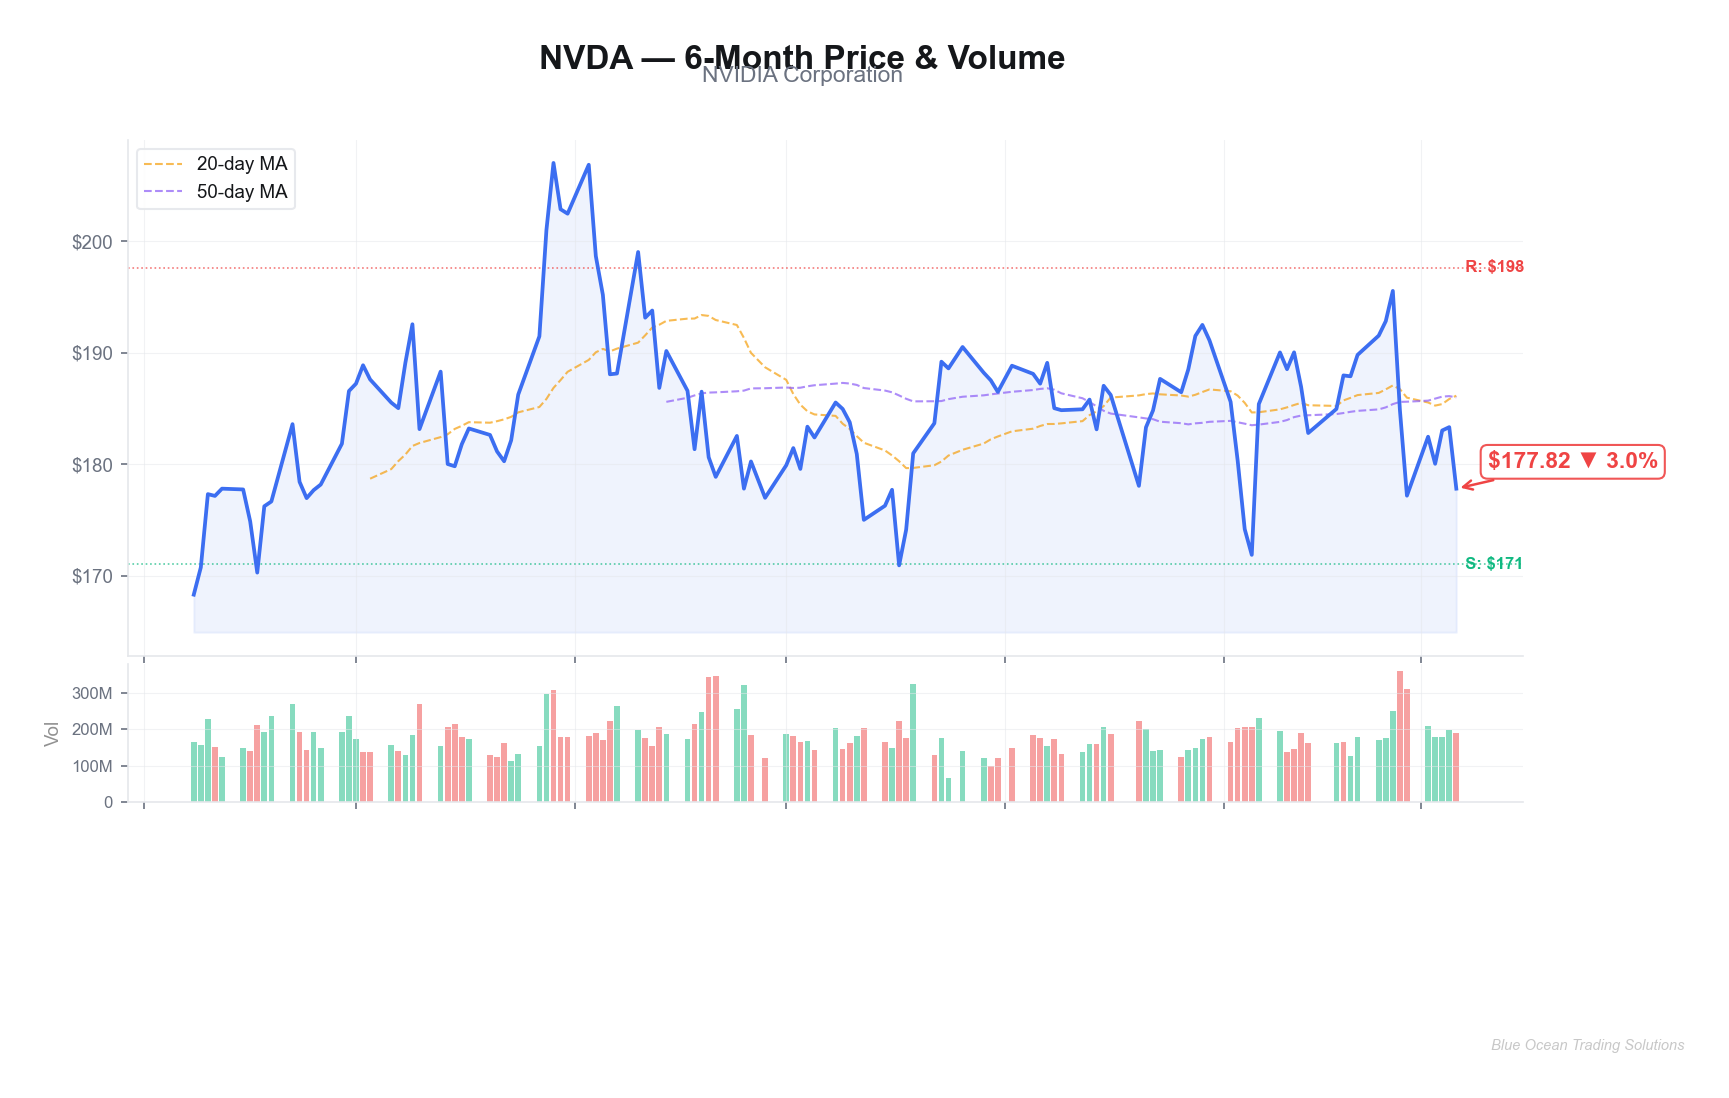
NVIDIA Corporation (NVDA) closed at $177.88 on March 8, 2026, down 2.98% on the session, with intraday price action ranging from $176.82 to $182.76. The stock remains in a broad consolidation pattern after reaching an all-time high near $212.19 in late 2025, and is currently trading approximately 16% below that peak. The 52-week range of $86.62–$212.19 underscores the magnitude of both the prior bull run and the present drawdown, with the stock having more than doubled from its annual low before reversing course.
From a trend structure perspective, the price action since the $212.19 high has traced a series of lower highs, placing the intermediate-term trend in a corrective phase. The $176–$180 zone has emerged as a near-term battleground, with bulls attempting to stabilize the decline and bears maintaining pressure with elevated volume. Today's session volume of approximately 189 million shares — modestly above the 176 million average — suggests heightened participation in the current leg lower, consistent with distribution rather than accumulation dynamics.
The 20-day and 50-day moving averages both remain above the current price, and the stock has been unable to reclaim either on a closing basis since early February. This bearish moving average configuration, combined with the absence of a meaningful bullish reversal pattern, indicates the path of least resistance remains to the downside in the near term. A failed retest of the 50-day moving average from below would reinforce this reading.
Volatility has expanded relative to the quieter periods of 2025, and the Bollinger Bands have widened accordingly. The stock is trading near the lower band on the daily chart, which historically has corresponded to short-term exhaustion points — though momentum indicators suggest these oversold conditions can persist for weeks before a durable reversal materializes.
On the weekly chart, NVDA's price structure remains within a multi-month corrective channel. The $160–$165 area represents a significant structural support zone dating back to mid-2024 accumulation activity, and a test of that level cannot be ruled out if the current breakdown below $177 extends. Conversely, a reclaim of the $185–$190 zone with conviction would be the first signal that the corrective phase may be stabilizing.
Levels and Context
The technical picture for NVDA as of March 8, 2026 reflects a stock in corrective mode, with the balance of evidence favoring continued consolidation or further downside before a meaningful trend change can be confirmed. Key price levels frame the near-term range and potential outcomes.
Support levels: The $176–$178 band is serving as immediate support; a sustained close below $175 would expose the $165–$168 area, a zone that captured significant buying interest during the mid-2024 breakout phase. Below that, the $150 round number and the high-volume node near $145 represent secondary support. The 200-day moving average, currently in the $158–$162 range depending on the exact trajectory, provides an additional technical anchor.
Resistance levels: On the upside, the $185–$190 zone represents the first meaningful overhead supply region, where the stock experienced heavy distribution in February. Beyond that, the $195–$200 area (confluence of the prior support-turned-resistance and the declining 50-day moving average) would need to be reclaimed for the technical picture to improve materially. The $210–$212 all-time high zone represents the ultimate resistance unless new fundamental catalysts emerge to support a fresh high.
Invalidation: A close above $195 on elevated volume would suggest the corrective phase is ending and would call for a reassessment of the bearish near-term bias. Conversely, a daily close below $170 would accelerate selling pressure toward the $160 support zone and signal that the correction is deeper than a typical retracement.
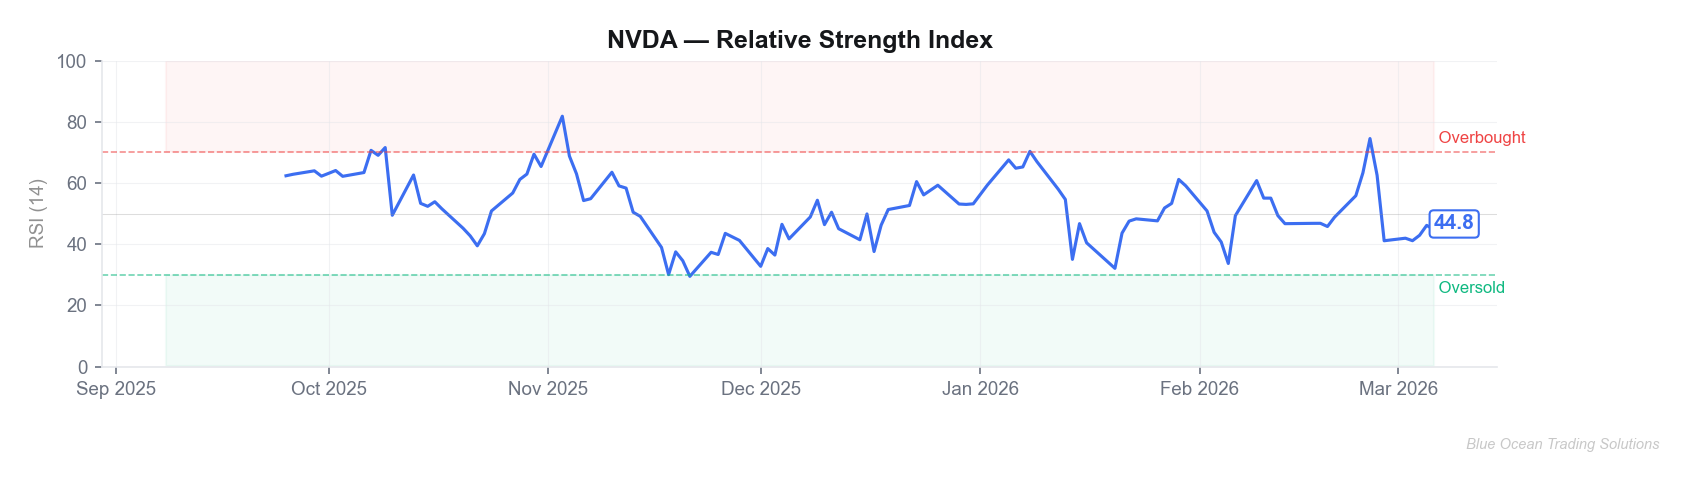
The current RSI reading of approximately 42 places NVDA in a weakened but not yet oversold condition on the daily timeframe. Historically, NVDA has found durable lows when RSI reaches the 30–35 range alongside capitulation-style volume — conditions that have not yet been met in the current decline.
Fundamental Snapshot
NVIDIA is the dominant provider of graphics processing units (GPUs) for artificial intelligence training and inference workloads, data center computing, gaming, and professional visualization. Its CUDA software ecosystem creates significant switching costs that have entrenched NVIDIA's competitive position across cloud hyperscalers, enterprise AI deployments, and research institutions. The company's data center segment — driven by its Hopper and Blackwell GPU architectures — has been the primary engine of revenue growth over the past two years.
At the current price of $177.88, NVDA trades at a trailing price-to-earnings ratio of 36.23x on earnings per share of $4.91. The market capitalization stands at approximately $4.32 trillion, positioning NVDA among the most valuable publicly traded companies globally. This valuation reflects the market's expectation of continued AI-driven revenue growth, though it also embeds a significant premium relative to historical semiconductor multiples.
The forward valuation debate centers on whether NVIDIA's current revenue trajectory — fueled by massive capital expenditure commitments from hyperscalers — is durable as the AI infrastructure build-out matures. Gross margins have remained elevated (historically above 70%) due to the pricing power afforded by GPU scarcity and ecosystem lock-in. Any compression in gross margins, either from competitive alternatives or from customers developing proprietary AI silicon, would represent a fundamental headwind not yet fully reflected in current consensus estimates.
The balance sheet remains fortress-strong, with substantial cash reserves and minimal leverage. NVIDIA has also been active in returning capital to shareholders through share repurchases. The key fundamental risk remains the concentration of revenues in large cloud customers and the cyclical nature of data center spending, which can shift rapidly as CapEx priorities evolve.
News & Catalyst Context
The current correction in NVDA shares is unfolding against a backdrop of several intersecting fundamental narratives. Investor sentiment has been tested by ongoing concerns about potential export restrictions on advanced AI chips to China and other markets, which represent a meaningful portion of NVIDIA's total addressable market. Any escalation in trade policy — particularly around semiconductor exports — has the potential to materially impact revenue forecasts for fiscal 2026 and 2027.
Simultaneously, the competitive landscape is shifting. Advanced Micro Devices (AMD) has continued to ramp its MI300X GPU series, and several large cloud providers have publicly announced the development of proprietary AI accelerators (Google's TPUs, Amazon's Trainium, Microsoft's Maia). While NVIDIA's ecosystem advantages remain formidable, the market is beginning to price in a longer-term scenario where GPU market share concentration gradually erodes.
On the positive catalyst side, NVIDIA's upcoming GTC developer conference — typically held in March — has historically served as a product roadmap showcase that can re-energize investor enthusiasm. Announcements around the Blackwell Ultra architecture or next-generation inference platforms could provide a near-term positive catalyst for the stock, assuming no negative macro events overshadow the event.
The broader semiconductor sector has been under pressure in early 2026 as investors rotate away from high-multiple growth names amid a rising interest rate environment and concerns about AI CapEx sustainability. NVDA's elevated beta means it has amplified these sector-wide moves in both directions.
Macro & Cross-Asset Backdrop
The macro environment in early March 2026 presents a challenging backdrop for high-multiple technology equities. Federal Reserve policy expectations have shifted toward a "higher for longer" stance following resilient economic data, with market participants pricing in fewer rate cuts in 2026 than previously anticipated. Rising real yields exert downward pressure on the discounted present value of long-duration growth assets — a dynamic that disproportionately affects stocks like NVDA with elevated forward P/E multiples.
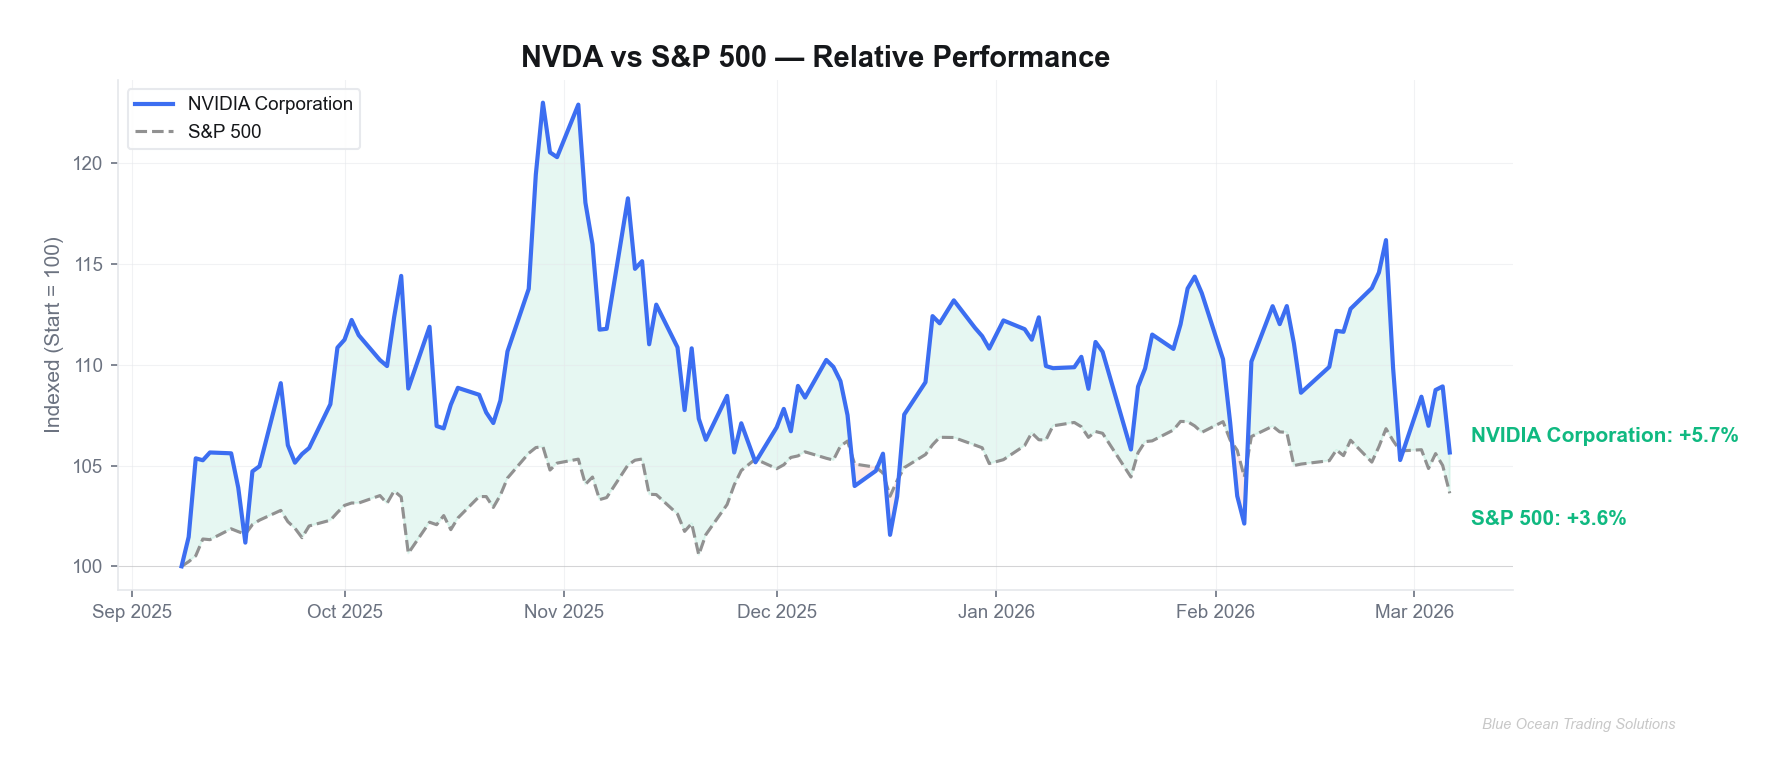
At the sector level, NVDA has been a notable underperformer relative to the S&P 500 over the past 60 days, consistent with a rotation from speculative growth toward more defensive and value-oriented sectors. The Philadelphia Semiconductor Index (SOX) has also underperformed the broader market, suggesting headwinds are sector-wide rather than company-specific.
Credit markets remain relatively calm, and there are no systemic risk signals that would suggest a broader equity market dislocation. However, the combination of compressed risk appetite in AI/semiconductor names, potential policy uncertainty around chip exports, and the technical breakdown below key moving averages in NVDA creates a risk-reward environment that favors patience over aggressive positioning.
Dollar strength and global growth uncertainty also weigh on multinational technology companies with significant overseas revenue exposure. NVIDIA derives a substantial portion of its revenues from international markets, making currency dynamics and geopolitical developments particularly relevant inputs to any comprehensive fundamental view.
Synthesis
The convergence of technical, fundamental, and macro observations for NVDA as of March 8, 2026 presents a nuanced picture. Technically, the stock is in a well-defined corrective phase after its historic run to all-time highs near $212, with momentum indicators below neutral and moving average structures pointing toward continued near-term headwinds. The $176–$178 support zone is under pressure, and a sustained breakdown would open a path toward $165 or lower.
Fundamentally, NVIDIA's competitive position in AI infrastructure remains largely intact, and the company's financial profile — strong margins, cash generation, and a dominant ecosystem — provides a durable underlying floor to valuation. However, the P/E ratio of 36.23x reflects a premium that requires continued execution on the Blackwell ramp and sustained hyperscaler CapEx to justify. Any shortfall in either dimension could accelerate the multiple compression already underway in the technical chart.
The news and macro context adds two layers of uncertainty: export policy risk represents a binary event risk that is difficult to quantify in price, and the broader "higher for longer" rate environment creates a structural headwind for the high-multiple technology sector. The upcoming GTC conference represents the most visible near-term catalyst, with the potential to shift sentiment in either direction depending on the product and guidance narrative presented.
Taken together, the technical setup suggests the corrective phase has not yet reached an exhaustion point, as RSI at 42 has room to decline further before reaching historically durable oversold readings. A patient observation of how the stock handles the $175–$178 support zone over the coming sessions, combined with attention to the sector's broader response to macroeconomic data, will be informative before any directional reassessment is warranted.
This research is for informational and educational purposes only. It does not constitute investment advice, a recommendation, or a solicitation to buy or sell any securities or digital assets. All analysis reflects technical and fundamental observations as of the publication date. Past performance is not indicative of future results. Always conduct your own due diligence and consult a licensed financial advisor before making investment decisions. Blue Ocean Trading Solutions and its contributors may hold positions in the assets discussed.


Comments ()