
BTC – Technical Market Research
Comprehensive technical analysis of BTC covering price action, momentum, fundamental context, and the macro backdrop.


Published March 8, 2026 | Crypto | BTC

Dominic Reeves
Digital Assets Analyst · Blue Ocean Trading Solutions
Technical Overview
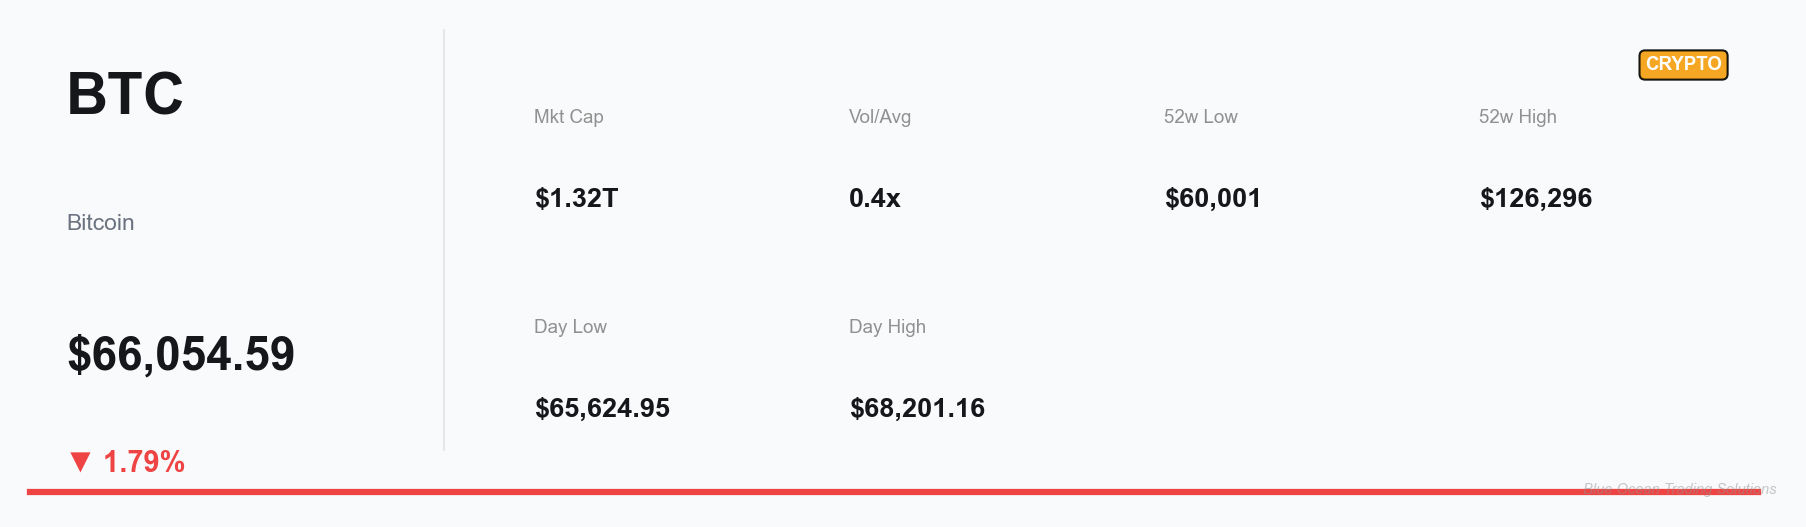
Bitcoin is trading at approximately $67,922, showing a modest 0.99% gain on the day as weekend trading volume remains subdued at $126 million against a daily average of $916 million. The current price represents a continuation of the consolidation pattern that has developed between $66,500 and $68,200 over the past three days, following the sharp decline from the $70,000+ levels seen in early March.
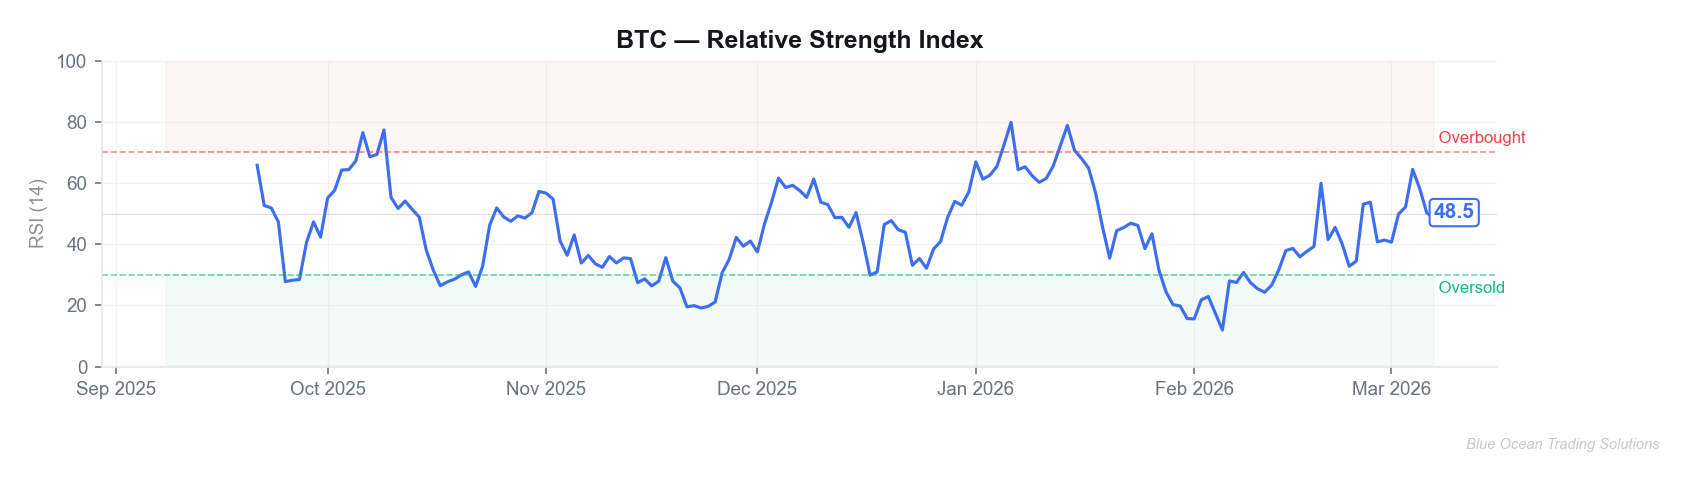
The 14-day RSI sits at 44.7, below the neutral 50 level and declining from 56.1 just three days ago. This downward RSI trajectory reflects persistent bearish pressure, though the indicator has not yet reached the oversold threshold of 30 that might signal exhaustion selling. The RSI has been trending lower since mid-February, consistent with the broader downtrend.
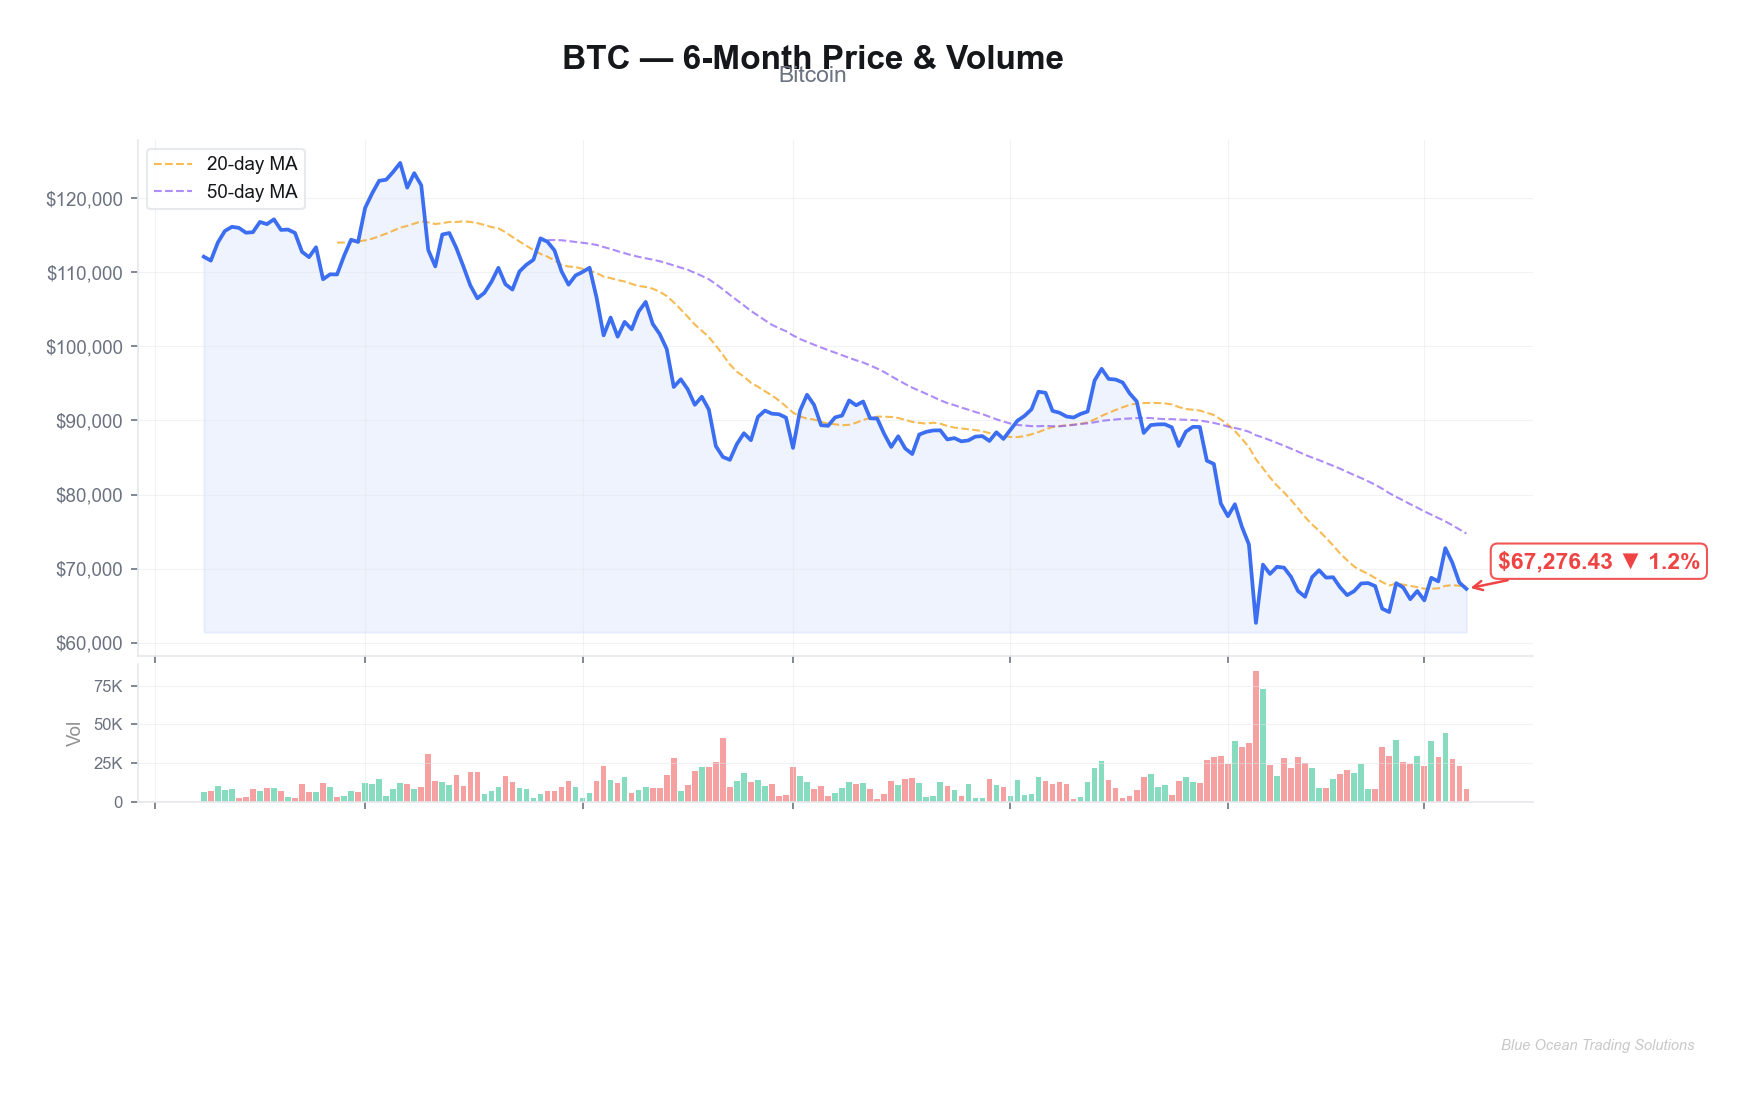
The six-month price structure tells a stark story: Bitcoin has declined from $112,073 in early September 2025 to the current $67,922 — a drawdown of approximately 39%. The decline accelerated in Q4 2025, with BTC falling from $90,000+ in December to the low-$70K range in February 2026, and then breaking below $70,000 in early March. The 52-week low of $60,001 represents a critical psychological and technical level that is now within approximately 12% of the current price.
The current consolidation near $67,000–$68,000 is occurring at a volume level well below average, typical of weekend trading but also suggestive of indecision among participants. A resolution of this range — either a break above $70,000 or below $66,500 — will likely determine the medium-term direction.
Levels and Context
The directional bias remains bearish as long as Bitcoin trades below $72,000, which represents the early March breakdown level and the declining 20-day moving average zone. Immediate resistance is the $68,200 intra-day high, followed by the $70,000 psychological level and the $71,400 resistance from March 6. A sustained move above $72,000 on elevated volume would be the first constructive signal for bulls.
On the downside, the $66,500 level (the March 8 low and recent multi-day support) is the immediate floor. A break below this level opens a path toward $63,000–$65,000, with the 52-week low of $60,001 as the ultimate support. A breach of $60,000 would likely trigger significant liquidation cascades and potentially accelerate the decline toward the $50,000–$55,000 zone.
Protocol Snapshot
Bitcoin's market capitalization stands at approximately $1.357 trillion, maintaining its position as the dominant cryptocurrency by a wide margin. The network continues to operate with consistent block production and high hash rate, reflecting robust miner commitment despite the price decline. The halving event of April 2024, which reduced the block reward from 6.25 to 3.125 BTC, has been fully absorbed by the market.
Bitcoin's current price of roughly $68,000 places it approximately 46% below its 52-week high of $126,296 — a level reached during the speculative excess of mid-2025. The magnitude of this drawdown, while painful for holders, is within the historical range of Bitcoin cycle corrections. Previous bull market corrections have ranged from 30% to 50% before resuming upward trends, though the timing and severity of recoveries have varied significantly.
On-chain metrics show that long-term holders (those who have held for more than 155 days) continue to accumulate, while short-term holders and leveraged traders have been the primary sellers during the recent decline. Exchange balances have been declining, suggesting that strategic accumulation is occurring at current levels even as the price trends lower.
News & Catalyst Context
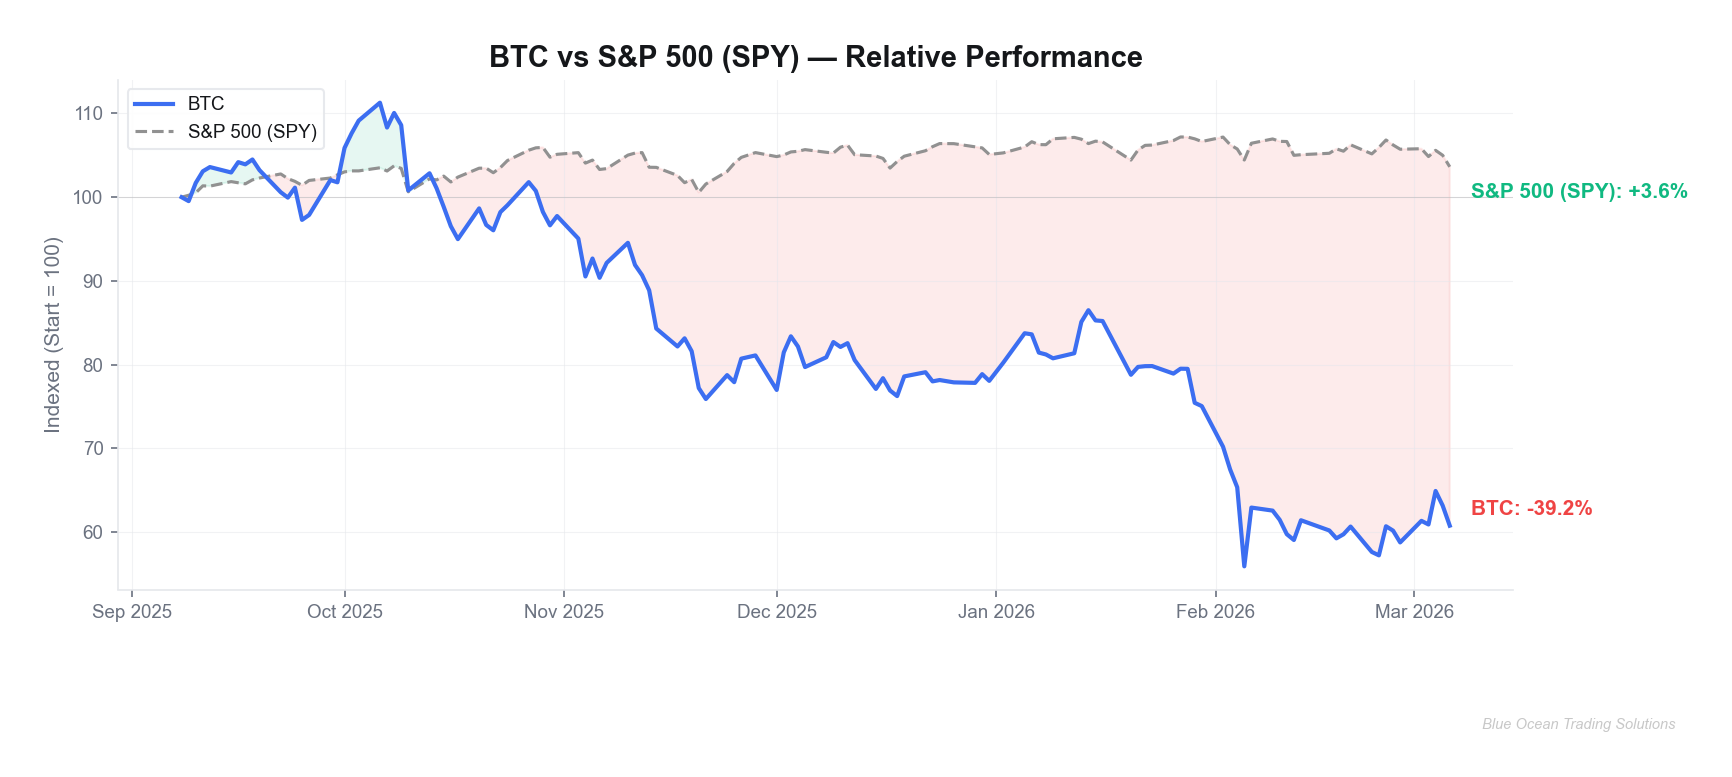
Bitcoin's decline from $90,000+ in December to $68,000 has been driven by a combination of macro headwinds and crypto-specific factors. The broader risk-off environment — characterized by equity market weakness, rising rate expectations, and trade policy uncertainty — has reduced appetite for speculative assets. Bitcoin's correlation with the Nasdaq has remained elevated, meaning tech selloffs have translated directly into crypto weakness.
The crypto market sentiment indicator reads Bearish, consistent with the sustained price decline and capital outflows from the sector. Bitcoin is trading approximately $20,000 below where it was one year ago, a relatively rare occurrence outside of confirmed bear markets. The ETF flow picture, which was a major tailwind during the 2024–2025 rally, has moderated as institutional enthusiasm wanes amid price weakness.
Macro & Cross-Asset Backdrop
The macro environment is decidedly unfavorable for risk assets. Equity market sentiment is bearish, with the SPY RSI at 38.6 and the semiconductor sector — often a leading indicator of risk appetite — under heavy selling pressure. Crypto-specific sentiment is also bearish, creating a double headwind for Bitcoin.
The U.S. dollar has been relatively firm, typically a negative factor for Bitcoin. Treasury yields and Federal Reserve policy expectations continue to influence crypto valuations, with the market pricing in fewer rate cuts than anticipated at the start of 2026. In this environment, Bitcoin's "digital gold" narrative competes with its "risk-on tech proxy" behavior, and the latter has been dominant in recent months.
Among altcoins, the picture is similarly muted: NEAR leads crypto gainers with a modest 3.13% gain, while the broader altcoin market shows no signs of the aggressive rotational flows that characterized previous bull market phases. Bitcoin dominance remains elevated, suggesting that when capital does flow into crypto, it gravitates toward BTC rather than taking on altcoin risk.
Synthesis
Bitcoin is in a pronounced downtrend, having lost roughly 39% from its September 2025 highs and 46% from the 52-week peak. The RSI at 44.7 indicates continued bearish pressure without yet reaching oversold exhaustion, and the declining volume on the current weekend consolidation does not suggest a reversal is imminent.
The technical picture presents a clear risk-reward framework: a break above $72,000 would signal that the current consolidation is forming a bottom, while a break below $66,500 would open the path toward the 52-week low of $60,001 — a level whose breach could trigger cascading liquidations. The macro backdrop offers little support for a near-term reversal, with both equity and crypto sentiment firmly bearish. For Bitcoin, the question is not whether the asset has long-term value, but whether the current cyclical downturn has fully priced in the prevailing headwinds or whether further downside remains before a sustainable base forms.
This research is for informational and educational purposes only and should not be construed as investment advice, a recommendation, or a solicitation to buy or sell any security. All analysis reflects publicly available data and the author's interpretation at the time of writing. Markets are dynamic; conditions can change rapidly. Past performance is not indicative of future results. Readers should conduct their own due diligence and consult a qualified financial advisor before making any investment decisions. Blue Ocean Trading Solutions and its contributors may hold positions in securities discussed herein.