LLY: The Tape vs The Consensus -- Initial Short Into Earnings


Rachel Kensington
Equities Analyst · Blue Ocean Trading Solutions
Published April 21, 2026 · LLY · Healthcare / Pharma
1. Technical Overview
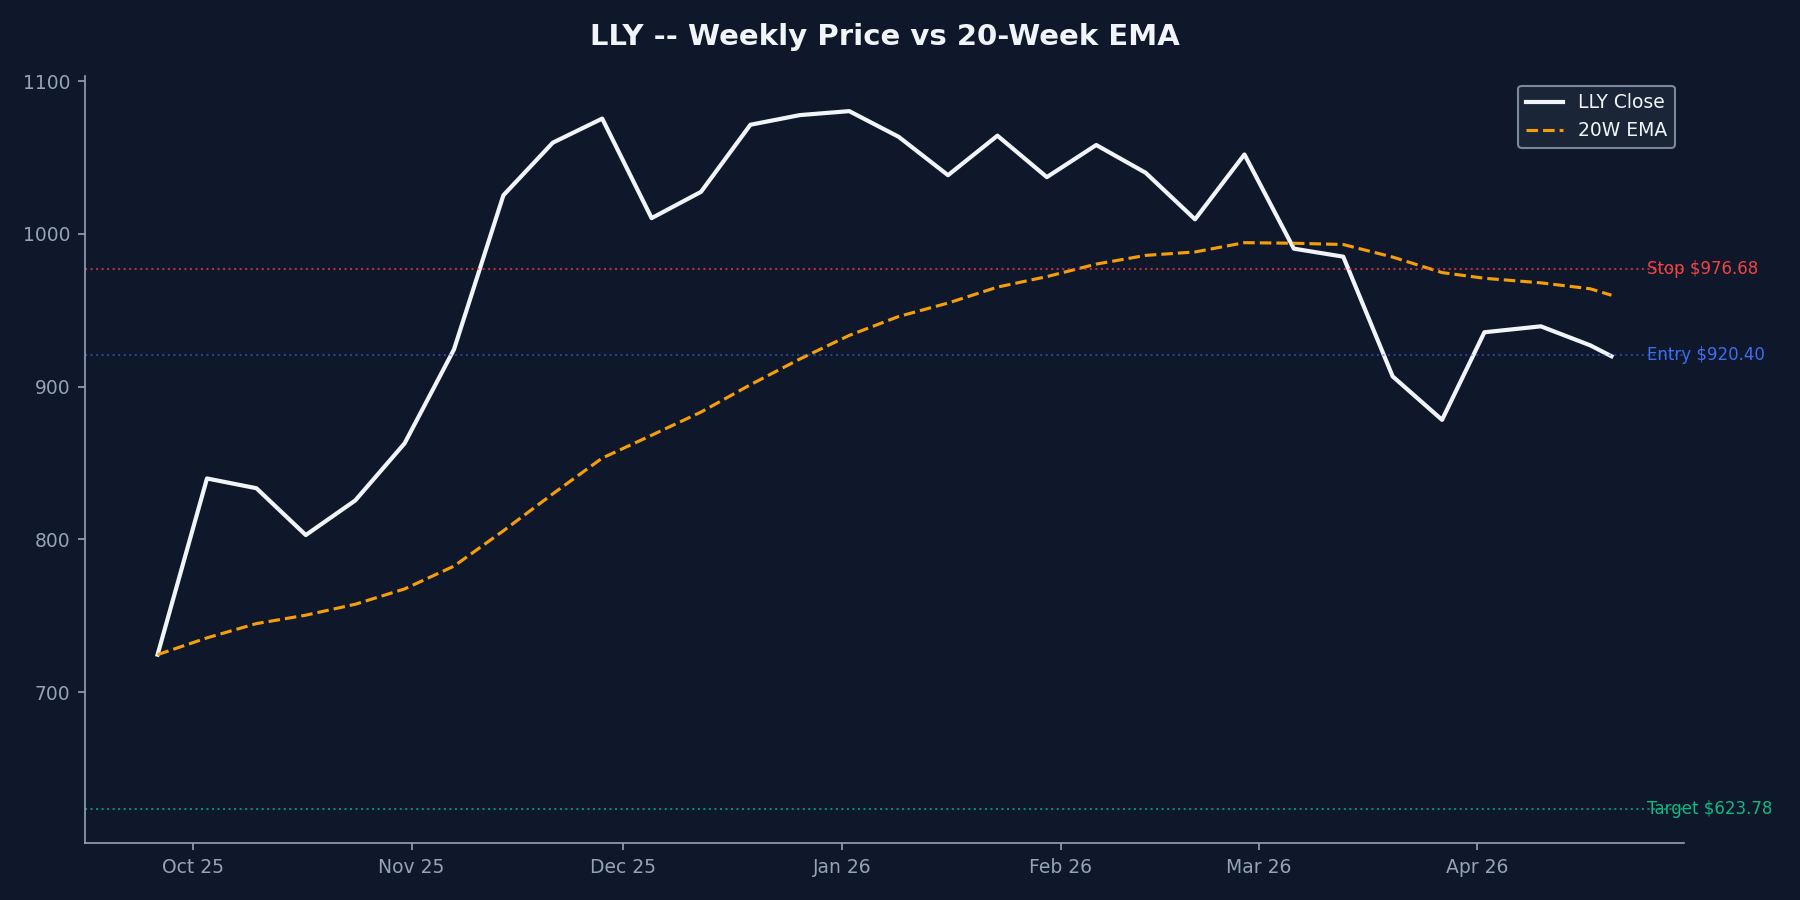
Eli Lilly (LLY) printed a fresh 2TFE short signal at Monday's close, breaking below both its 10-day EMA at $923 and its 20-week EMA at $961 for a sustained third week. The stock settled at $920.40 -- down from the $1,080 high set in early January, a 15% drawdown with the character of a genuine trend change, not a shakeout. The weekly posture flipped bearish at the February close around $1,010, and every rally attempt since has failed to reclaim $961.
The 14-day RSI at 45 is neutral. That matters. An exhausted short would show RSI in the 30s; a shakeout within a larger uptrend would show RSI holding 50+. Instead we have a clean middle reading -- the market has neither panicked nor lost conviction in the breakdown. Combined with the XLV sector being the only major sector currently below its 20-week EMA (RSI 47), this is a setup where the single-name technicals align with sector-level weakness.
This is an Initial short signal in the truest sense. LLY last crossed its 10D EMA with bearish intent on April 13 in a messy two-way tape, but the structure was still above the 20W EMA. What happened Monday is the first clean 10D cross with the 20W already below -- the textbook secondary entry that initiates the move.