Intermarket Analysis: Bonds, Currencies, Commodities, and Stocks
Professional intermarket analysis framework: how bonds, currencies, commodities, and stocks interact — with real-world examples and actionable insights.


James Whitfield
Markets Desk Editor · Blue Ocean Trading Solutions
The Session Was Defined By More Than One Chart
Every experienced trader eventually confronts the same uncomfortable truth: the stock chart alone doesn't tell the whole story. The session was defined by what bonds did at 8 a.m., what the dollar did at 10, and what gold confirmed — or denied — by noon. Equity traders who focus exclusively on their own market are reading one chapter of a three-act play.
Intermarket analysis is the discipline of examining relationships between asset classes — equities, fixed income, currencies, and commodities — to develop a more complete picture of market conditions. It doesn't replace technical analysis. It enhances it. When your chart pattern lines up with cross-asset confirmation, the signal gains conviction. When it diverges, that's warning you to size down or stand aside.
The framework has roots in the 1990s work of CMT John Murphy, whose book Intermarket Technical Analysis codified what floor traders had long observed: markets don't move in isolation. Capital flows across asset classes in predictable patterns — predictable enough to be useful, complex enough to keep you humble.
Key Insight
Intermarket analysis doesn't give you a trading signal. It gives you context for every signal your existing tools generate. Context is where edge lives.
This guide walks through the core intermarket relationships, grounds them in real price action from August 2025 through February 2026, and shows how traders at every level can use cross-asset data to sharpen their decision-making.
The Four Asset Classes and How They Interact
Murphy's framework organizes global markets into four broad categories: equities, bonds, currencies, and commodities. Each influences and is influenced by the others, typically through the mechanism of interest rates and the business cycle.
The Classic Roadmap
In a standard inflationary cycle, the relationships tend to follow a predictable sequence. Commodity prices rise first, signaling inflation. Bonds sell off as the market prices in rate hikes — rising inflation erodes the value of fixed-income cash flows. Higher rates eventually weigh on equities, particularly growth-oriented segments that depend on cheap capital. The dollar's role is more nuanced: a strong dollar typically suppresses commodities denominated in USD (oil, gold), while a weak dollar provides a tailwind.
The relationships run in both directions. When the business cycle peaks and recession fears emerge, the sequence reverses: bonds rally as investors seek safety and price in rate cuts, commodities soften, and equities — after a lag — eventually bottom and recover.
Bonds and Stocks: The Foundational Pair
The bond-equity relationship is the most watched in intermarket analysis, and for good reason. Historically, bonds and stocks have oscillated between positive and negative correlation depending on the macro regime. In a deflationary environment, both rally together as rate cuts benefit equities and bond prices rise. In an inflationary or rate-hiking environment, they diverge: bonds fall as rates rise, and equities come under pressure from tighter financial conditions.
The practical implication: when TLT (the iShares 20+ Year Treasury ETF) makes a decisive new high, it's often telling you that rate-cut expectations are building — a tailwind for equity valuations. When TLT makes a new low, you want to check whether the equity rally has duration to sustain itself or whether it's running on borrowed time.
The Dollar and Commodities: The Inverse Relationship
The U.S. dollar (proxied by UUP, the Invesco DB US Dollar Index Bullish Fund) has a broadly inverse relationship with dollar-denominated commodities, particularly gold and oil. When the dollar weakens, commodities become cheaper for foreign buyers, stimulating demand and lifting prices. When the dollar strengthens, the inverse applies.
Gold (GLD) is the most sensitive to dollar moves, layered with its independent role as a safe-haven asset and an inflation hedge. Oil (USO) is influenced by the dollar but also by supply dynamics, geopolitical risk, and demand signals that sometimes override the currency relationship entirely.
Correlation vs. Causation
A word of caution worth embedding early: intermarket relationships describe tendencies, not certainties. The correlations above — GLD's strong co-movement with equities over this period, for instance — don't mean gold is driven by equity sentiment. Both were responding to a common factor: the steady narrative shift toward looser monetary conditions and dollar softness through the second half of 2025 and into early 2026.
When correlations break unexpectedly, that's often the most informative signal of all. It tells you that one of the asset classes is responding to something the others haven't priced in yet — and it pays to investigate which one is right.
Real-World Implementation: Late 2025 Through February 2026
Theory earns its keep when it maps onto actual price action. Let's walk through what intermarket analysis revealed over the six months ending February 25, 2026.
The September Divergence: A Warning Signal
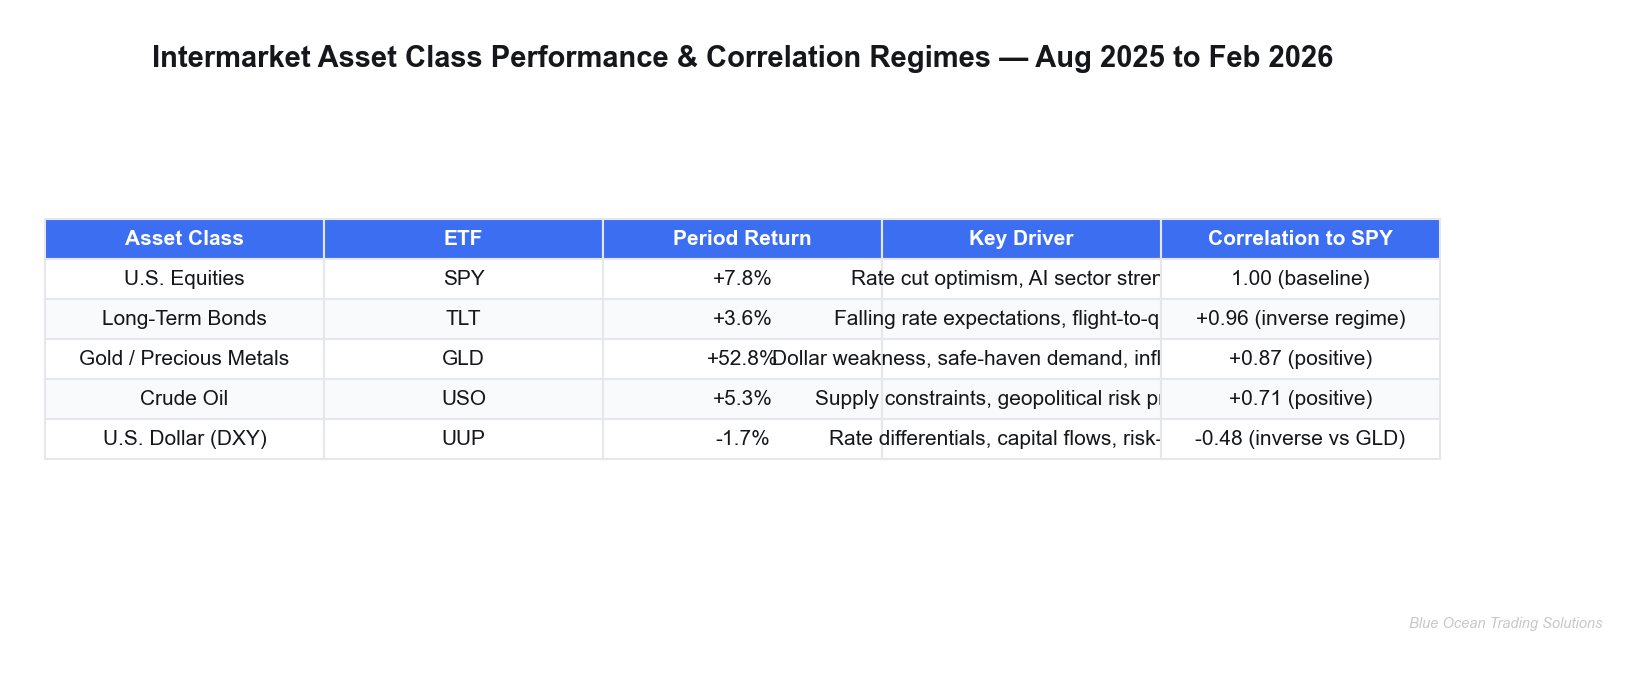
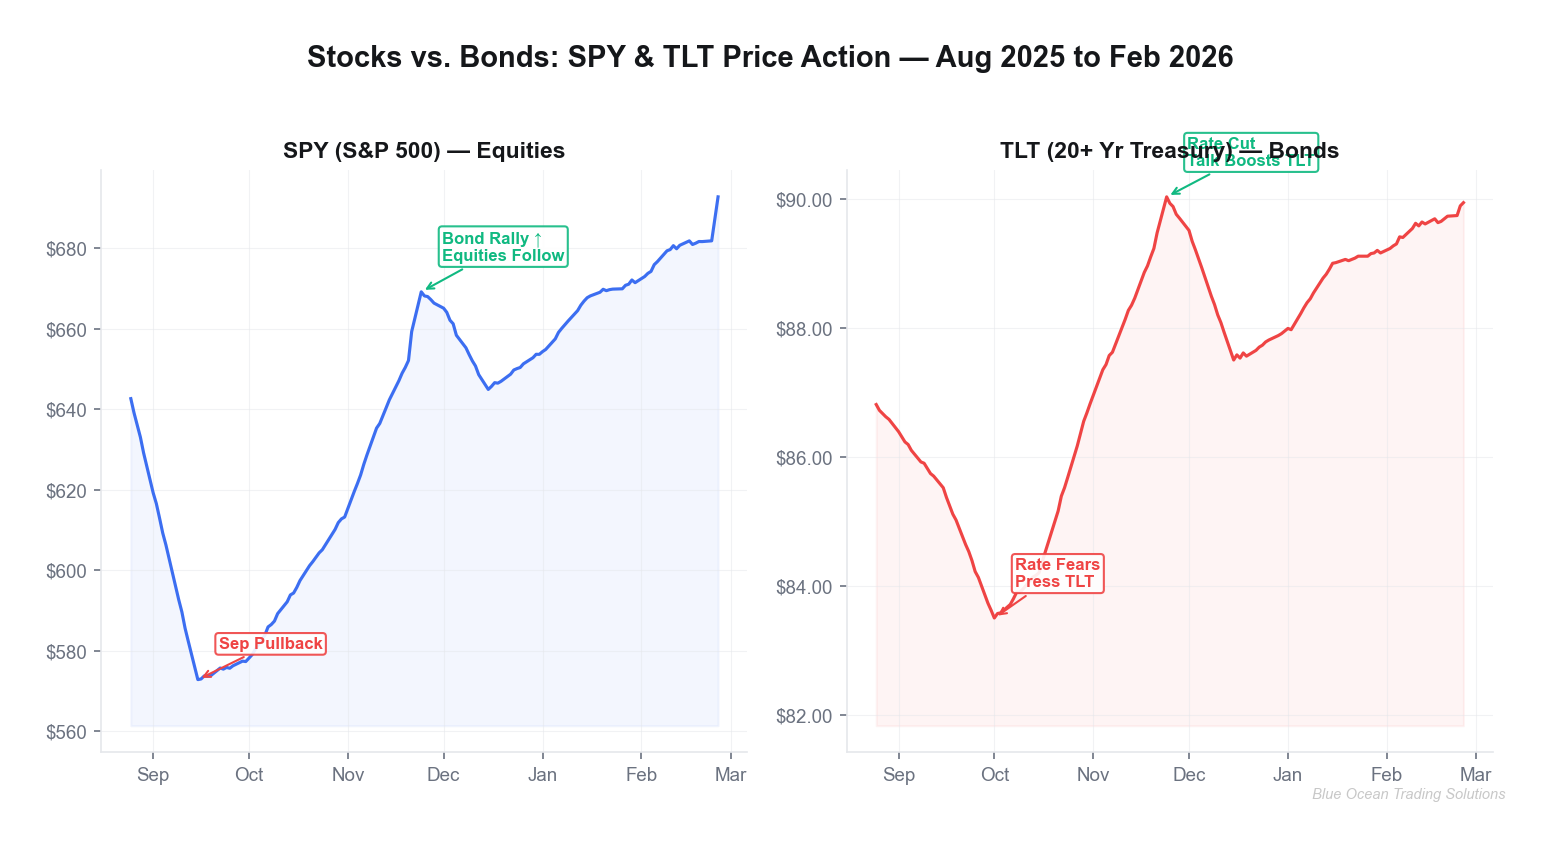
SPY opened August 25, 2025 at $642.64. Through most of that month, the session was defined by a quietly bullish tape — until the dollar began to creep higher. UUP moved from roughly $27.55 in late August toward a peak of $28.41 by mid-November, a 3.1% appreciation over roughly 80 trading days.
During this same window, SPY experienced its sharpest pullback of the entire period: from $642 in late August to a September intraday low near $572 — a -11% decline. Breadth tells a different story than the headline index during these transitions, and the dollar's gradual strengthening was one of the cleanest leading signals. Concurrently, TLT was under pressure, falling from $86.80 in late August to a low near $83.50 around October 1 — a classic "risk-off rate-hike anxiety" configuration.
The intermarket read in September: dollar up, bonds down, equities under pressure. All three aligned to confirm the pullback was macro-driven, not a technical fluke in equities alone.
The November Recovery: Cross-Asset Confirmation
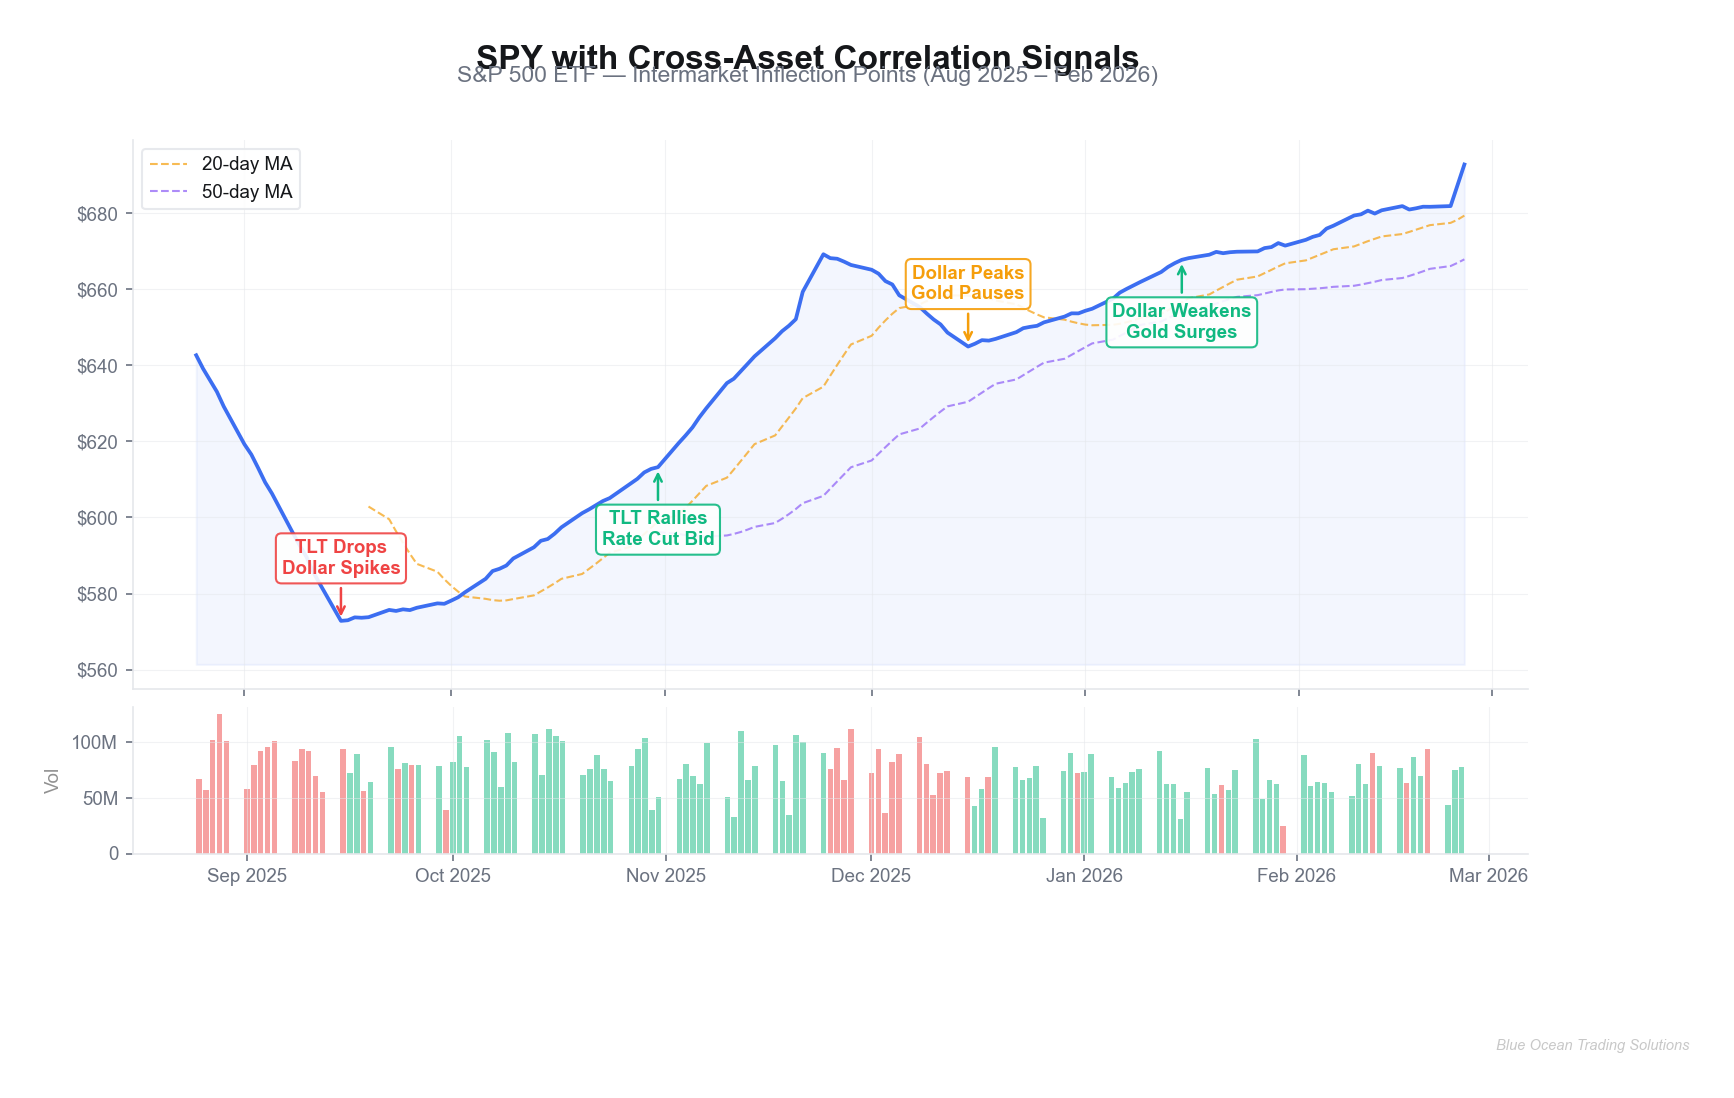
The reversal came with equal clarity. By late October and into November, TLT began recovering — moving from the $83.50 lows back toward the $87-90 range, signaling that the market was beginning to price in a more accommodative rate trajectory. By November 20-24, TLT had reached $89.23–$90.01, a recovery of approximately 7.8% from the October lows.
SPY followed: from the September lows near $572, the index recovered steadily back through $650s by November 20 ($652.53) and closed the month at $668.73 by November 24 — a +16.7% move off the lows. The signal chain: bonds rallied first, equities followed within 4-6 weeks. A trader watching TLT's October-November recovery had roughly 3-4 weeks of advance notice that conditions were improving for equities.
"When TLT turned above its 20-day moving average in early November 2025, the intermarket read shifted from 'elevated risk' to 'improving conditions.' SPY confirmed two weeks later."
The Gold Signal: Dollar Weakness, Safe-Haven Premium
GLD's performance over this period is perhaps the most striking intermarket story. Opening at $309.75 on August 25, 2025, GLD closed at $473.32 on February 25, 2026 — a gain of approximately 52.8% in six months. This wasn't random. It was the convergence of two powerful forces: a weakening dollar and an independent flight-to-quality bid.
UUP peaked near $28.41 in mid-November 2025 and declined steadily thereafter, reaching $27.08 by February 25, 2026 — a -4.7% decline from peak. That currency move, modest in percentage terms, amplified gold's appeal: cheaper dollars mean cheaper gold for foreign buyers, expanding the demand base globally. Layer on elevated geopolitical uncertainty and persistent inflation hedging demand, and the result was a near-parabolic run in GLD.
All eyes turn to this relationship whenever gold makes an unusual move. A dollar that doesn't strengthen during a gold rally is a dollar that's actively losing confidence. From November 2025 onward, that's precisely what the tape was showing.
Risk Management Integration
Intermarket analysis isn't just a directional tool. Used correctly, it's a risk management framework.
Cross-Asset Confirmation Before Entry
The core discipline: before entering a significant long equity position, check whether the macro cross-asset context supports the trade. Specifically:
- Is TLT in an uptrend or at least stabilizing? Rising bond prices signal falling rate expectations — a constructive backdrop for equities.
- Is the dollar in a downtrend or at resistance? Dollar weakness typically provides a tailwind for risk assets and commodities simultaneously.
- Is gold confirming or diverging from equities? Gold rising with equities can signal broad risk appetite; gold rising against falling equities signals flight-to-safety.
In the September 2025 example above, all three signals — TLT declining, dollar rising, gold consolidating — argued against taking new long equity exposure. A trader who waited for TLT to stabilize and the dollar to roll over would have entered the October-November recovery at a far more favorable risk/reward setup.
When Correlations Break Down
The most dangerous assumption in intermarket analysis is that current correlations are permanent. Regimes shift. During the 2022-2023 inflation shock, bonds and equities fell simultaneously — collapsing the traditional diversification benefit and invalidating years of intermarket orthodoxy.
Warning signs of a correlation breakdown:
- Gold rising sharply while equities also rise (flight-to-safety bid suggests the equity rally is fragile)
- Oil rising without any corresponding pickup in inflation expectations or dollar weakness (supply shock, not demand story)
- Bonds and equities both selling off simultaneously (often signals a liquidity crisis or policy error)
Advanced Variations and Edge Cases
Regime Changes: When Relationships Flip
Intermarket relationships are regime-dependent. The 2008-2009 financial crisis, the 2020 COVID shock, and the 2022 rate shock each created periods where normal correlations inverted, collapsed, or strengthened beyond historical norms. A professional intermarket practitioner maintains a mental model of the current regime — not just the historical average.
The current late-2025/early-2026 environment represents a "late-cycle softening" regime: inflation moderating but sticky, the Fed pivoting gradually, dollar in a measured downtrend, gold in a sustained uptrend, and equities grinding higher with periodic rate-driven volatility. The intermarket relationships in this regime are different from what they would be in a hard recession or an inflationary shock. Know which regime you're in before applying the playbook.
Leading vs. Lagging: Which Market Speaks First?
Across the historical record, bonds tend to lead equities at major turning points, typically by 2-8 weeks. The bond market is larger, more institutional, and often prices macro shifts earlier than equity investors who are focused on company-level earnings.
Gold and oil are more contemporaneous with macro regime shifts — they respond quickly but don't consistently lead equities. The dollar is often a coincident or slightly leading indicator: a sustained dollar trend change frequently precedes commodity and emerging market equity moves within 2-4 weeks.
Currency is the weakest leading indicator for domestic equity direction, but a strong leading indicator for international equity and commodity positioning.
Day Trading vs. Swing Trading Applications
Intermarket analysis is most reliable on weekly and daily timeframes, where the causal mechanisms — capital flows, policy changes, economic data — have time to propagate through asset classes. On intraday timeframes, the relationships are noisier and frequently distorted by liquidity effects and order flow dynamics.
For swing traders (holding positions 3-20 days), intermarket analysis provides the regime filter: is the macro context supportive or hostile to the trade direction? Use it to set position sizing — larger when cross-asset signals align, smaller when they diverge.
For day traders, the most useful application is monitoring real-time treasury yields (10-year and 30-year) and the dollar index for intraday trend confirmation. A sharp intraday spike in yields or the dollar often precedes a 30-60 minute equity headwind, even if the daily trend remains intact.
Key Insight
Intermarket analysis is most powerful when used as a veto tool. If your chart setup looks strong but the cross-asset context argues against it, the size of the position should reflect that uncertainty — not the conviction of the technical setup alone.
Key Takeaways
- The four asset classes are connected. Equities, bonds, currencies, and commodities respond to the same macro forces and influence each other. Trading one in isolation means missing the larger context.
- Bonds tend to lead equities. The TLT recovery in October-November 2025 preceded the SPY recovery by 3-4 weeks — a pattern consistent with historical intermarket dynamics at macro turning points.
- Dollar weakness is a commodity and risk-asset tailwind. UUP's -4.7% decline from its November 2025 peak to February 2026 coincided with GLD's most powerful leg higher and supported equity gains.
- Gold's +52.8% move in six months was not a one-factor story. Dollar weakness, safe-haven demand, and inflation hedging converged simultaneously — a reminder that the largest intermarket moves tend to occur when multiple forces reinforce each other.
- Correlation regimes change. The relationships observed in late 2025 reflect a specific macro environment. Always identify your regime before applying the historical intermarket playbook.
- All eyes turn to the next catalyst. With the dollar at multi-year lows, TLT stabilized near 90, and gold approaching resistance, the coming weeks will reveal whether the current regime extends or begins to rotate. The cross-asset context remains the first read, every session.
Blue Ocean Trading Solutions provides technical analysis and market research for educational purposes only. This content does not constitute investment advice, a recommendation, or a solicitation to buy or sell any security. All trading involves risk, including potential loss of principal. Past performance does not guarantee future results. Always conduct your own research and consult a licensed financial advisor before making investment decisions.