Multi-Timeframe Analysis: How to Align Weekly Structure With Daily Execution
How professional traders align weekly structural bias with daily execution triggers — using the 20-week EMA and 10-day EMA as a two-timeframe system. Real examples from SPY, SLV, and AMZN.


Marcus Chen
ETF & Sector Strategist · Blue Ocean Trading Solutions
The Problem Most Swing Traders Never Solve
Most swing traders operate on a single timeframe and wonder why their setups keep failing at the worst possible moments. They find a clean daily breakout, take the trade — and then watch it reverse into a structural weekly downtrend they never checked. Multi-timeframe analysis solves this. But it only works if you use both timeframes with discipline: the weekly chart defines the structure, the daily chart executes within it. Never the other way around.
This article is the second installment in our education series on the Two-Timeframe Edge (2TFE) — Blue Ocean's core framework for identifying and timing high-probability swing trades. If you read the first piece on the foundational system by James Whitfield, you already know the architecture. Here, we go operational. I'll walk through exactly how to read the weekly chart first, how the 20-week EMA defines structural bias, and how the 10-day EMA becomes your precision execution trigger. Three real examples from the current market — SPY, SLV, and AMZN — show what this looks like in practice, including both the Initial and Continuation signal types.
The examples in this article all come from the period surrounding the ceasefire-driven gap on April 8, 2026 — a session that produced posture flips across multiple major assets simultaneously and remains one of the cleaner multi-timeframe setups we've seen this year.
The Architecture: Two EMAs, Two Jobs
The Two-Timeframe Edge runs on two exponential moving averages, each with a precisely defined role. Understanding the division of labor between them is the entire concept:
- 20-Week EMA — the structural bias filter. A weekly close above this level means the asset is in a bullish posture. Below it means bearish. This single line determines the permissible trade direction. In a bullish posture, you look for long entries only. In a bearish posture, shorts only. No exceptions.
- 10-Day EMA — the execution trigger. This is the daily timing layer. Within an established weekly bias, a cross of the 10-day EMA in the direction of that bias is the trigger to act. The weekly tells you which side of the trade to be on. The daily tells you when to pull the trigger.
The Golden Rule that governs every trade: never trade against the higher-timeframe bias. A bullish daily signal against a bearish weekly posture is not a setup — it is noise. A strong weekly bounce in a downtrend is a rally into resistance, not a buy signal. The framework enforces direction discipline by design.
Key Insight
The 20-week EMA is not a support or resistance line in the traditional sense — it is a posture classifier. Its value is not the exact number; it is what side of that number the price closes on. A weekly close of $671.01 above a $671.00 EMA carries the same structural meaning as a close at $690. Both are bullish posture. The precision of the EMA matters far less than the binary structural conclusion it produces.
Initial vs. Continuation: Two Signal Types, Different Risk Profiles
The framework recognizes two distinct entry signal types. Understanding which signal you are trading is critical — they carry different risk profiles, different R:R expectations, and different failure modes.
What Is an Initial Signal?
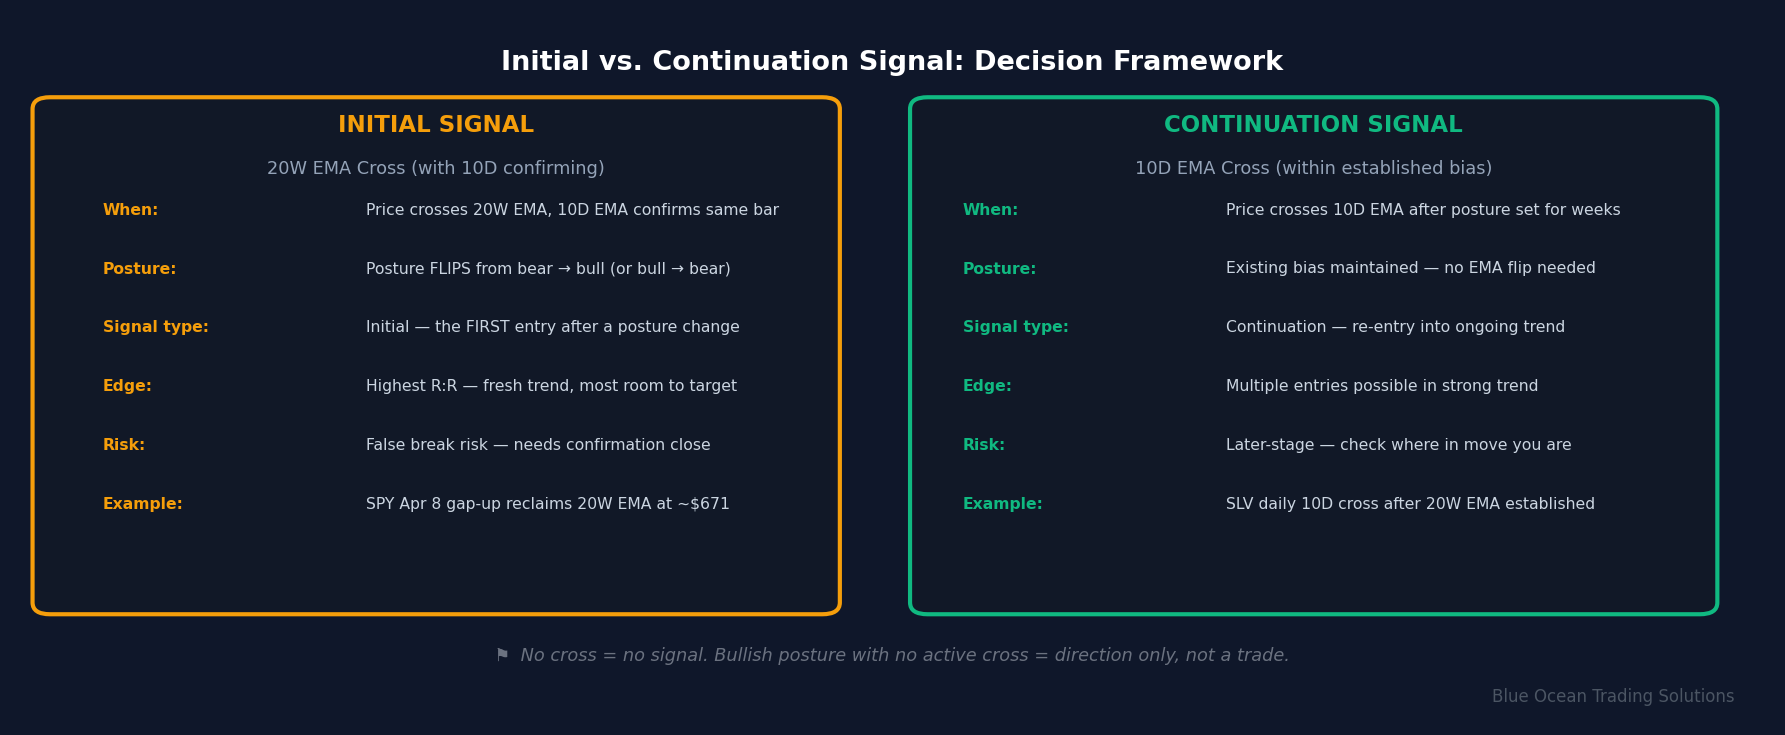
An Initial signal occurs when price crosses the 20-week EMA and the 10-day EMA confirms on or near the same bar — specifically, the first signal after a posture flip. This is the entry that captures the transition from one structural state to another. The signal type is defined at the moment of entry and does not change — if a setup was Initial when published, it remains Initial even on day four or five of the move.
Initial signals carry the highest potential R:R because you are entering at the structural inflection point, closest to the 20-week EMA with maximum room to the nearest weekly swing target. The tradeoff is false-break risk — not every posture flip follows through. Volume and the macro backdrop are critical validators at these moments.
What Is a Continuation Signal?
A Continuation signal occurs when price crosses the 10-day EMA in the direction of an already-established weekly bias — after the posture has been set for multiple weeks. An asset sitting comfortably above its 10-day EMA with no recent cross has no active signal; it is simply in a trending posture. The cross itself is the trigger.
Continuation signals offer multiple re-entry opportunities within a sustained trend. They tend to have tighter stops (the nearest daily swing low rather than the full EMA zone) but also closer R:R mechanics since the move is more mature. The critical judgment call: where in the trend are you? An asset 12% above its 20-week EMA on a Continuation signal deserves more scrutiny than one at 3% above.
One hard rule: no signal = no setup. A bullish posture with no active cross is a direction — not a trade idea. Do not force entries where neither signal type applies.
Real-World Examples: Three Setups From the April 8 Catalyst Window
The ceasefire announcement on April 8, 2026 created simultaneous posture flips across multiple major assets — a rare cluster of Initial signals in a single session. The three examples below illustrate the Initial and Continuation signal types using real price action and calculated EMA levels.
Example 1: SPY — A Textbook Posture Flip
The S&P 500 ETF spent six consecutive weekly closes below its 20-week EMA from early March through early April 2026, establishing a clear bearish posture. The 20-week EMA drifted from approximately $680 down toward $670 as price fell from the $685 range to lows near $630. The weekly bias was unambiguously bearish — any daily bounce during this period was structurally a rally into resistance, not a buy signal. That distinction alone would have kept most traders from getting long too early.
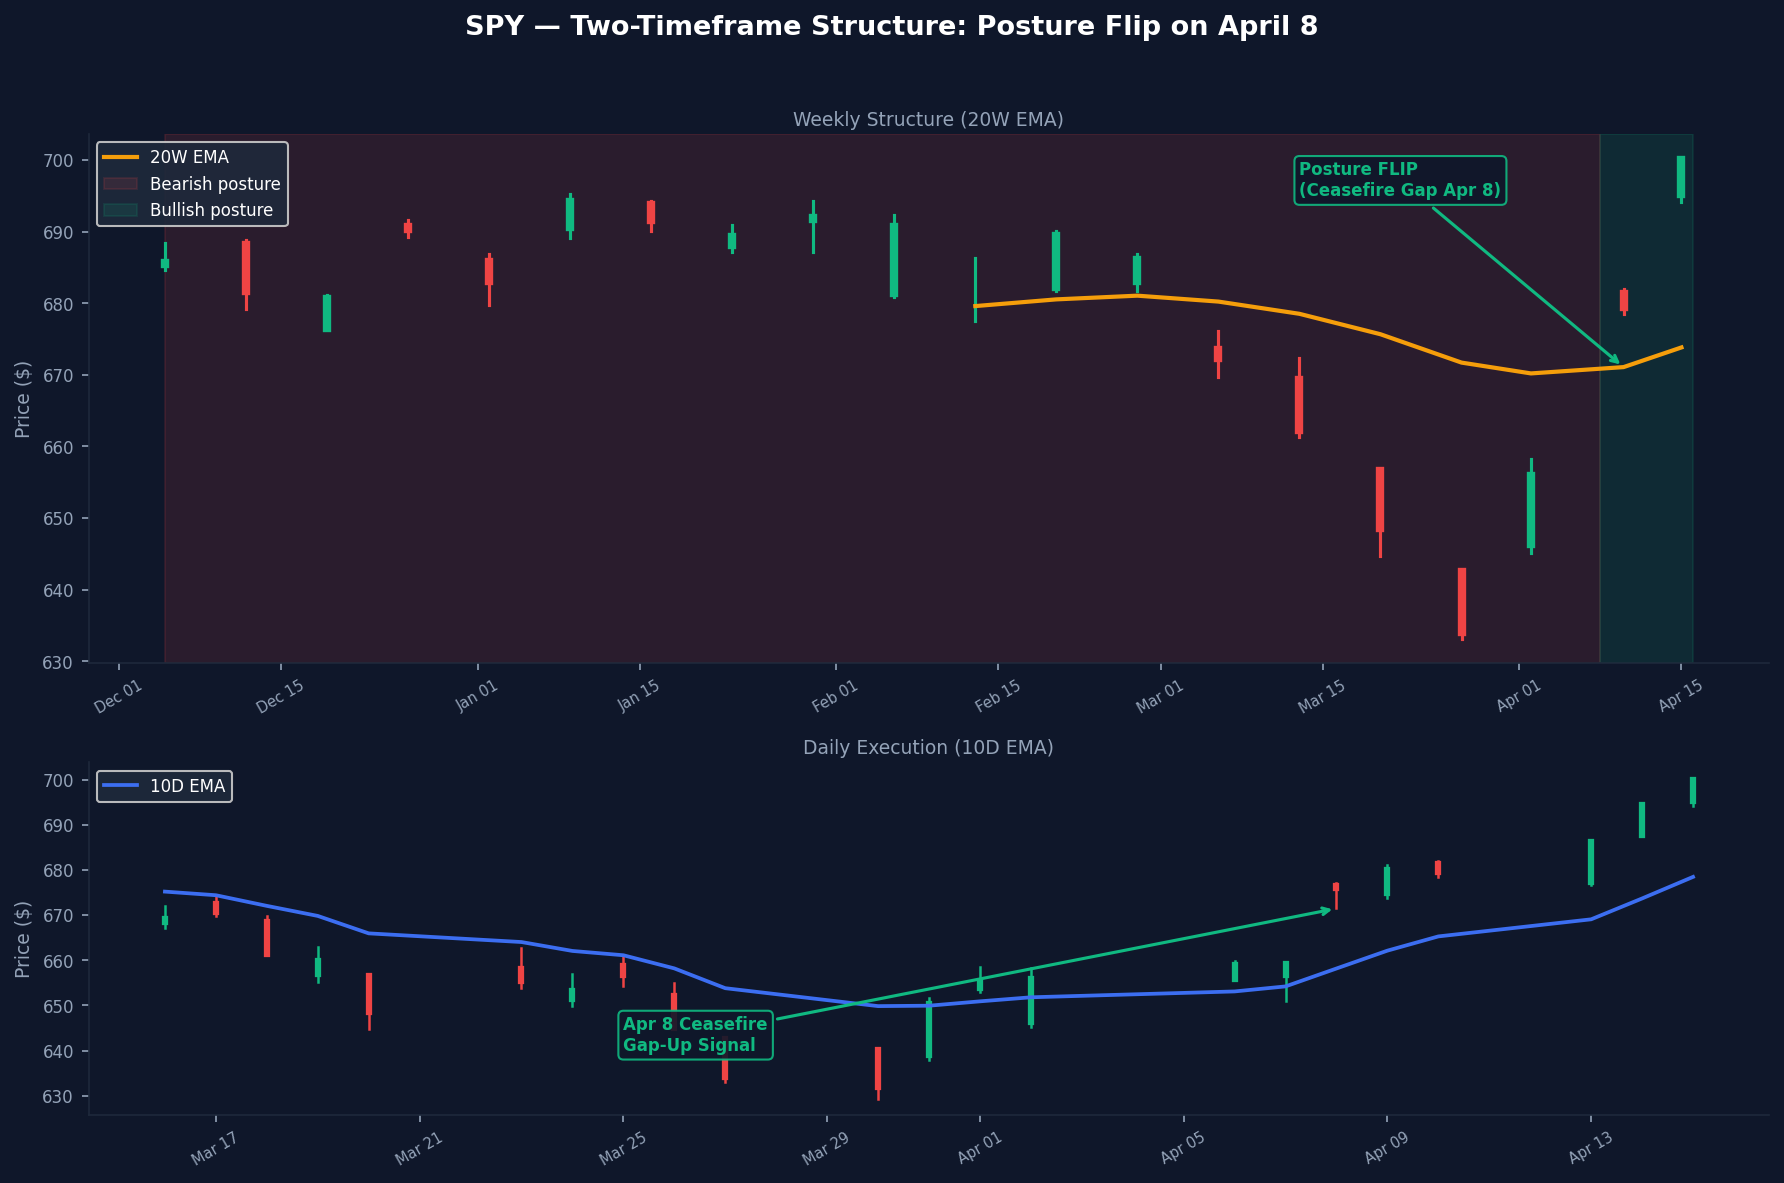
On April 8, SPY gapped up sharply — the ceasefire catalyst — and closed at approximately $676, reclaiming the 20-week EMA (sitting near $671) in a single session. The weekly posture flipped from bearish to bullish. The 10-day EMA confirmed on the same daily bar, crossing above the 10D level that had been acting as overhead resistance. This is a textbook Initial signal: a posture flip at the 20-week EMA with daily EMA confirmation on the same bar.
What made this setup high-conviction was the macro catalyst reinforcing the technical signal. The ceasefire gap was not random volatility — it was a macro event removing a known risk overhang, providing a credible narrative for follow-through. By April 15, SPY was trading near $700, roughly 4.2% above the Initial entry zone near $671-$676. The structural setup and the macro catalyst aligned at the same moment.
The key judgment call at the entry: was this a genuine posture flip or a gap that would fade? The distinguishing factors were (1) volume — the April 8 session ran at elevated volume relative to the prior two weeks of low-volume drift, and (2) the macro rationale was a discrete, identifiable event rather than random price action. When the tape absorbs a bullish macro catalyst with price moving strongly above a structural level, that is a different tape character than a low-volume drift above the EMA.
Example 2: SLV — Initial Signal Into a CPI-Driven Continuation
iShares Silver Trust presented a different but equally instructive setup. Unlike SPY, SLV's posture story started several weeks earlier. After an extreme parabolic run in late January 2026 (from the $60s to a peak near $92), silver corrected sharply and consolidated in the $60-$66 range throughout March and into early April. During this consolidation, the 20-week EMA sat near $64-$65 — and the weekly closes were hovering just above and below that level, creating a zone of ambiguous posture.
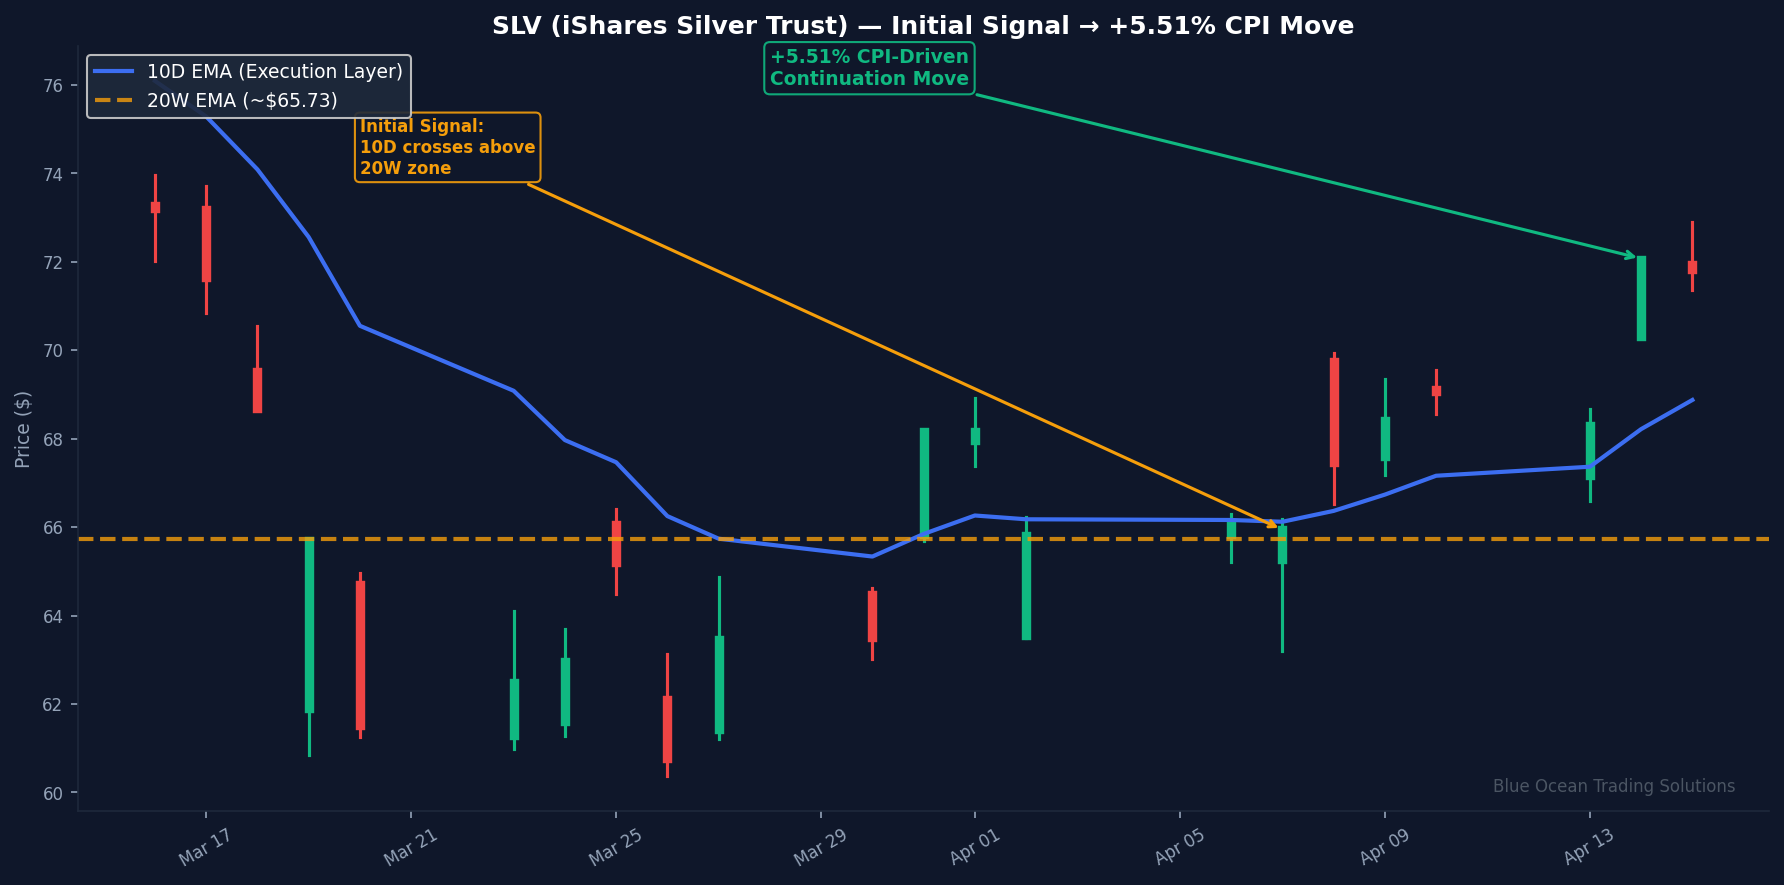
The Initial signal framework became clear around the April 7-10 window: SLV was closing at $65-$69 with the 20-week EMA near $65. Weekly close above, 10-day EMA turning up and crossing in the direction of the bias. The posture was establishing as bullish after weeks of ambiguity. The key was not jumping ahead of the signal but waiting for the definitive close above the 20-week EMA with the 10D confirming the direction — the structural confirmation that the consolidation period was resolving to the upside.
The payoff arrived on April 14. The CPI data release acted as a catalyst, with SLV surging approximately +5.51% in a single session, trading from roughly $70.27 to close at $72.04. The macro driver was inflation-sensitive positioning — silver as both a precious metal and an industrial commodity benefits from CPI surprises in a specific way that pure equity plays do not. The weekly structure had already identified this as a bullish setup; the CPI event was the catalyst that accelerated the daily execution.
This is a critical illustration of how the framework operates in practice: the weekly chart told you which side of the trade to be on (bullish, above the 20W EMA) days before the catalyst hit. Traders who checked the weekly structure first were already positioned. Traders watching only the daily chart either missed the entry zone or chased the +5.51% move after it was over.
Example 3: AMZN — Reclaiming the 20W EMA After a Multi-Week Downtrend
Amazon had been in a sustained bearish posture since late January 2026, when the stock broke below its 20-week EMA (near $217-$220 at the time) following a Q4 earnings reaction and broader market weakness. For nine consecutive weeks, AMZN closed below the 20-week EMA — every daily bounce during this period was structurally a rally into resistance. The February through early April consolidation in the $199-$214 range was a textbook bearish-posture sideways chop: no sustained trend, but below the structural bias line.
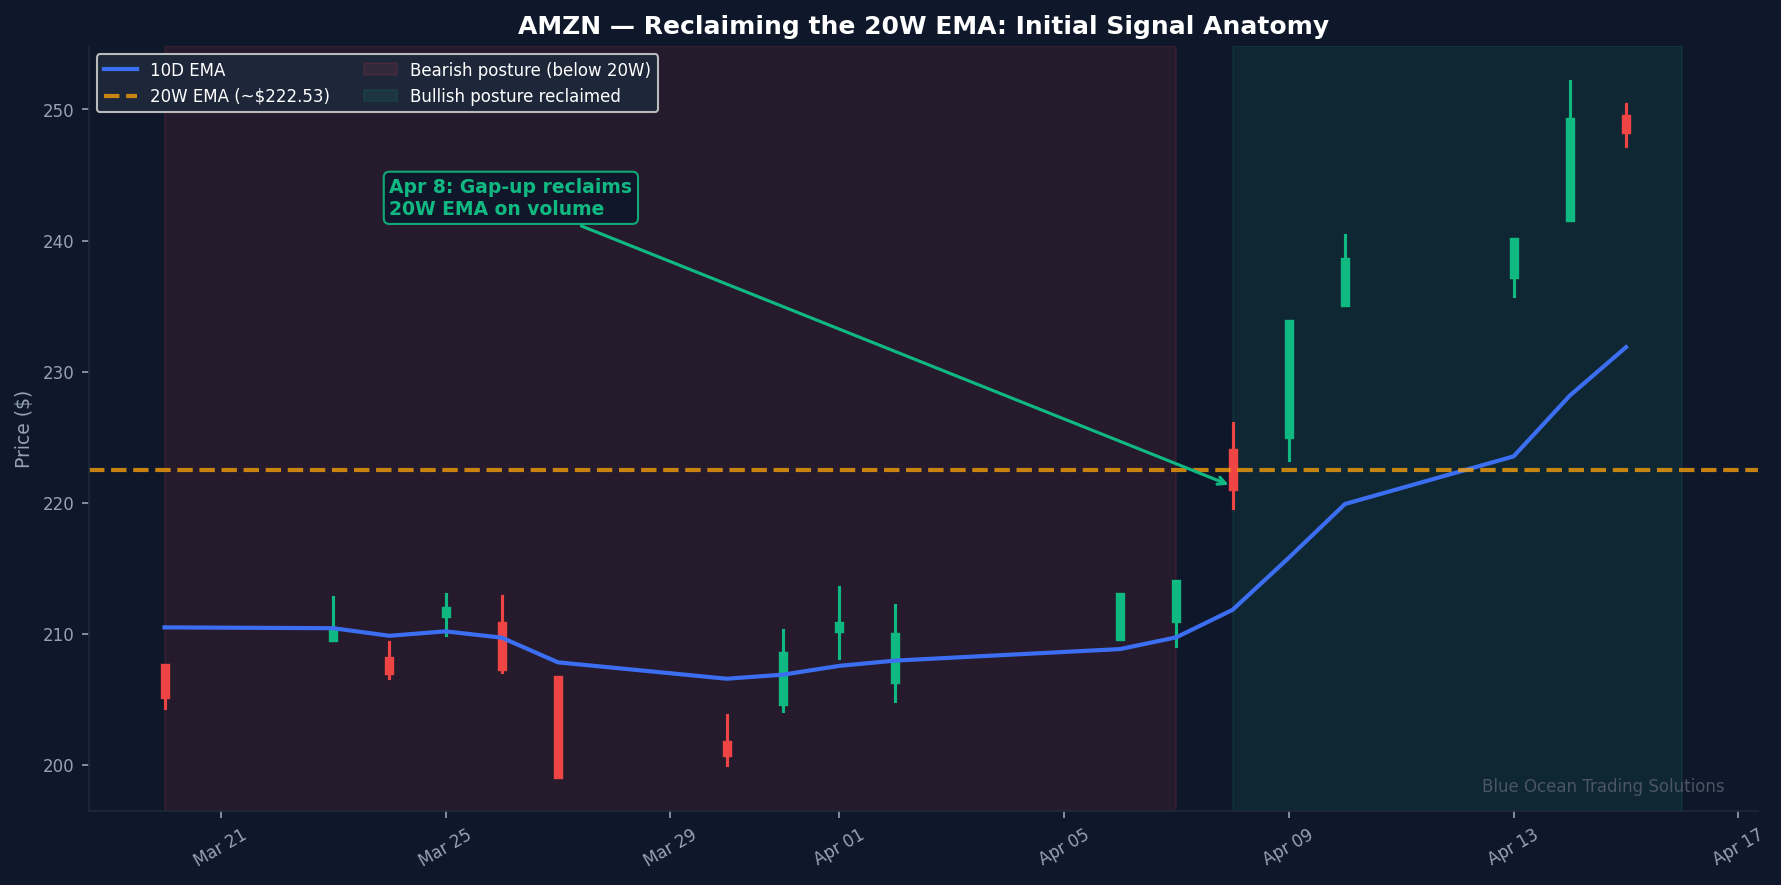
The April 8 ceasefire gap changed everything for AMZN. The stock gapped up from approximately $213.77 to open at $223.79 and close at $221.25 — decisively pushing through the 20-week EMA zone near $219-$220. By April 10, AMZN was trading at $238.38 with the 20-week EMA at approximately $219.80. The posture had flipped to bullish, and the 10-day EMA was rising sharply — a clean Initial signal with structural confirmation from both EMAs.
By April 15, AMZN was trading at $248.50 — a move of approximately 13% from the 20-week EMA breakout zone in seven trading sessions. The structural read from the weekly chart alone identified this as the highest-probability setup window: fresh cross of the 20-week EMA after a nine-week bearish posture represents maximum potential for trend development. Early in a new trend, with the most room to prior weekly swing highs, is where the Initial signal earns its premium R:R.
How to Read the Charts: The Step-by-Step Process
The practical workflow is sequential and non-negotiable in its order. Starting with the daily chart is the most common mistake active traders make:
- Open the weekly chart first. Identify the 20-week EMA. Is the most recent weekly close above or below it? This is your posture: bullish (above) or bearish (below). Write it down. This is the direction you are allowed to trade.
- Check for a recent posture flip or established bias. Has the weekly posture changed in the last 1-2 weekly bars? That is Initial signal territory. If the posture has been established for multiple weeks, you are in Continuation territory.
- Drop to the daily chart. Now apply the 10-day EMA. In the direction of your weekly bias, has a cross occurred in the last 1-2 daily bars? If yes, that is your entry trigger. If no — if price is sitting above the 10-day EMA with no recent cross — there is no active signal.
- Apply the judgment layer. Where in the move are you? Is this a fresh signal at the 20-week EMA, or are you entering a trend that is already 8% extended? What does volume say about conviction? What is the macro backdrop?
- Validate the levels. Set your stop at the nearest daily swing low (for longs). Identify the nearest weekly swing high as the target. Calculate R:R. If it is below 1.5:1, pass.
Common Mistake: Starting With the Daily
Trading a clean daily setup without checking the weekly posture is the single most costly mistake in multi-timeframe analysis. The daily breakout looks clean. The entry calculates well. The setup gets taken. And then it reverses — not because the daily analysis was wrong, but because the weekly structure was working against it the whole time. The weekly chart provides context that the daily chart cannot see. Always start with weekly.
Common Mistakes That Undermine the Framework
Understanding the framework's failure modes is as important as understanding the setup itself. These are the patterns that cause traders to use a sound methodology and still lose money:
1. Trading the daily without checking the weekly. Already covered above — this is the cardinal error. No amount of daily precision compensates for being on the wrong structural side.
2. Fighting the higher timeframe. This appears as "the weekly is bearish, but the daily looks so clean." The Golden Rule has no exceptions. A bearish-posture rally is a short entry point, not a long entry point. The strength of the rally does not change the structural conclusion — it changes the quality of the short.
3. Treating posture as a static label. Posture is re-evaluated on each weekly close. An asset that was bearish last week can flip to bullish this week. An asset that has been bullish for 14 weeks can lose posture in a single session. Always check the current state, not the remembered state.
4. Entering without an active cross. A bullish posture does not mean buy now. A bullish posture means you are looking for a specific trigger — the 10-day EMA cross in the direction of the weekly bias. Without that trigger, there is no setup, only a direction. Patience between setups is not a weakness — it is how the framework protects capital.
5. Ignoring where in the move you are. An Initial signal at the 20-week EMA captures the most favorable risk-reward zone in the entire framework. A Continuation signal five weeks into a trend that is already 15% extended is a fundamentally different risk proposition. The signal mechanics are the same; the judgment around them must account for position in the trend.
Advanced Application: Cross-Asset Posture Maps
The real power of multi-timeframe analysis emerges when you run it systematically across a broad universe — not just one or two tickers. At Blue Ocean, every morning scan evaluates the 20-week EMA posture for 36 assets across equities, ETFs, commodities, and crypto. The output is a posture map: a clear picture of how many assets are bullish versus bearish and where capital is flowing structurally.
During the March-April 2026 correction, the posture map was signaling something important: while indices like SPY were breaking below their 20-week EMAs, commodities (SLV, GLD) and certain sector ETFs were maintaining bullish posture or flipping bullish as indices weakened. This kind of divergence — where some assets hold above their structural levels while the broad market breaks — often signals where the next rotation is happening. Multi-timeframe analysis applied across an asset universe becomes sector rotation intelligence.
The April 8 ceasefire produced a simultaneous posture flip across multiple assets — a high-volume, macro-driven structural reset. When posture flips are happening in clusters across correlated assets on the same catalyst, the signal carries more weight than an isolated flip. The broad structural reset on April 8 was a different situation from a single asset quietly drifting above its 20-week EMA on low volume.
Key Takeaways
- Always read weekly before daily. The 20-week EMA determines structural bias. This is the permission layer. Only after you know the posture do you look at the daily for timing.
- Initial signals offer the best R:R. A fresh 20-week EMA cross with 10-day confirmation is the setup the framework is designed to capture. This is where you are entering at the structural inflection point with maximum room to target.
- Continuation signals require judgment about position in trend. Multiple re-entries are possible in strong trends, but each successive Continuation signal carries more execution risk than the Initial. Know where in the move you are.
- No signal = no trade. Bullish posture without an active 10-day EMA cross is direction, not a setup. Discipline between signals is where the edge is preserved.
- The Golden Rule is absolute. Do not trade against the weekly posture. A strong daily bounce in a bearish posture is a short, not a long. The framework enforces direction discipline because that is where most traders lose their edge.
- Volume and macro context validate structural signals. The April 8 setups in SPY, SLV, and AMZN were high-conviction not because of the EMA math alone — but because the macro catalyst, the volume character, and the structural levels all aligned simultaneously. When the tape confirms what the framework shows, that is the highest-probability setup available.
The Two-Timeframe Edge framework is described in full detail — including how we build posture maps, evaluate signals, and manage positions — in the free guide at blueoceantradingsolutions.com/free-guide/.
Paid members get our trade ideas with specific entries, targets, stops, and R:R — every trading morning in the Pre-Market Brief.
Disclaimer: This report is for informational and educational purposes only and does not constitute investment advice, a solicitation, or a recommendation to buy or sell any security. All analysis is based on publicly available data and technical observations. Past performance is not indicative of future results. Trading involves substantial risk of loss. Always conduct your own due diligence and consult a qualified financial advisor before making investment decisions. Blue Ocean Trading Solutions and its analysts may hold positions in securities discussed.