
Daily EMA Crossovers: The Execution Layer of a Two-Timeframe System
Daily EMA crossovers are not a trend system -- they are an execution layer. Learn how to filter them through the weekly 20-EMA to turn a coin-flip signal into a high-probability trigger.


Dominic Reeves
Digital Assets Analyst · Blue Ocean Trading Solutions
Published April 22, 2026 · Trading Education · Technical Analysis
Why Daily EMA Crossovers Matter in a Two-Timeframe System
Most traders first encounter the daily EMA crossover as a standalone signal. Price crosses above the 10-day exponential moving average -- buy. Price crosses below -- sell. Back-test that in isolation on Bitcoin over the last 18 months and the system is a coin flip. There are stretches where it works brilliantly and stretches where it chops you to death. That is the rap on moving average systems generally: they look clean on the good months and devastating on the sideways ones.
The on-chain picture paints a different story when the same signal is filtered through a higher-timeframe trend. Daily EMA crossovers are not a complete trading system on their own -- they are an execution layer. They answer the question "when do I pull the trigger?" They cannot answer "which direction should I be trading?" That question belongs to a different timeframe entirely. When you separate the two jobs, the whole framework stops feeling like gambling and starts feeling like a craft.
This article is about the execution layer. We will walk through what daily 10-EMA crossovers actually signal, how to filter the noise out of them using a weekly structural lens, and how the same crossover can be a high-probability trigger in one regime and a money pit in another. This cycle's structure suggests we are at an inflection in digital assets where this distinction matters more than ever -- so the examples are drawn from Bitcoin and Ethereum price action over the last three months.
The 10-Day EMA Is a Momentum Filter, Not a Trend Filter
Start with what the 10-day exponential moving average actually measures. It is a weighted average of the last ten daily closes, with more weight placed on the most recent sessions. The mathematical effect: the 10-EMA lags price -- but not by much. On average, over ten trading days, it captures the direction of momentum over approximately the last two weeks. Nothing deeper.
That is its strength and its weakness in one sentence. Because it responds quickly to price, the 10-EMA generates a lot of signals. You will see 15-25 daily EMA crosses per year on any liquid asset. But because it responds quickly, it also flips frequently during sideways consolidation. A stock or coin that is range-bound for six weeks will produce six or seven false crossovers while going nowhere. Taking every cross is a guaranteed way to pay the spread twenty times and end up where you started.
The correct framing: the 10-EMA cross tells you something has shifted -- specifically, the short-term momentum tide has turned. It does not tell you whether that shift is part of a larger move or a blip in a range. That second question needs a different tool.
Key Insight
A 10-day EMA crossover signals momentum has turned. It does not signal that the trend has turned. Confusing the two is the single most expensive mistake in EMA-based trading.
The Two-Timeframe Edge: Weekly Filters, Daily Triggers
At Blue Ocean, we define the trend using the 20-week exponential moving average. It is the structural anchor of our entire research framework. Price above the 20-week EMA means we are operating in a bullish regime for that asset. Price below means bearish regime. That is it. No interpretation. No exceptions. The 20-week EMA is the dividing line that determines which side of the book we are working on.
Why a weekly timeframe rather than a monthly or daily? Because a week captures one full institutional cycle. Monday through Friday is how capital flows, how earnings are reported, how macro data is digested. The 20-week EMA smooths approximately five months of weekly closes -- enough to filter out noise, not so much that it lags useful reversals by quarters. It is the empirical sweet spot for capturing structural trends without sacrificing responsiveness.
This is the Two-Timeframe Edge. The weekly EMA sets the directional bias. The daily EMA sets the execution trigger. You only take long setups on 10-day EMA crosses when price is above the 20-week EMA. You only take short setups on bearish 10-day crosses when price is below the 20-week EMA. Every other crossover gets ignored. This single rule -- two filters stacked -- eliminates roughly half the signals that a single-timeframe system would flag, and those are exactly the signals most likely to fail.
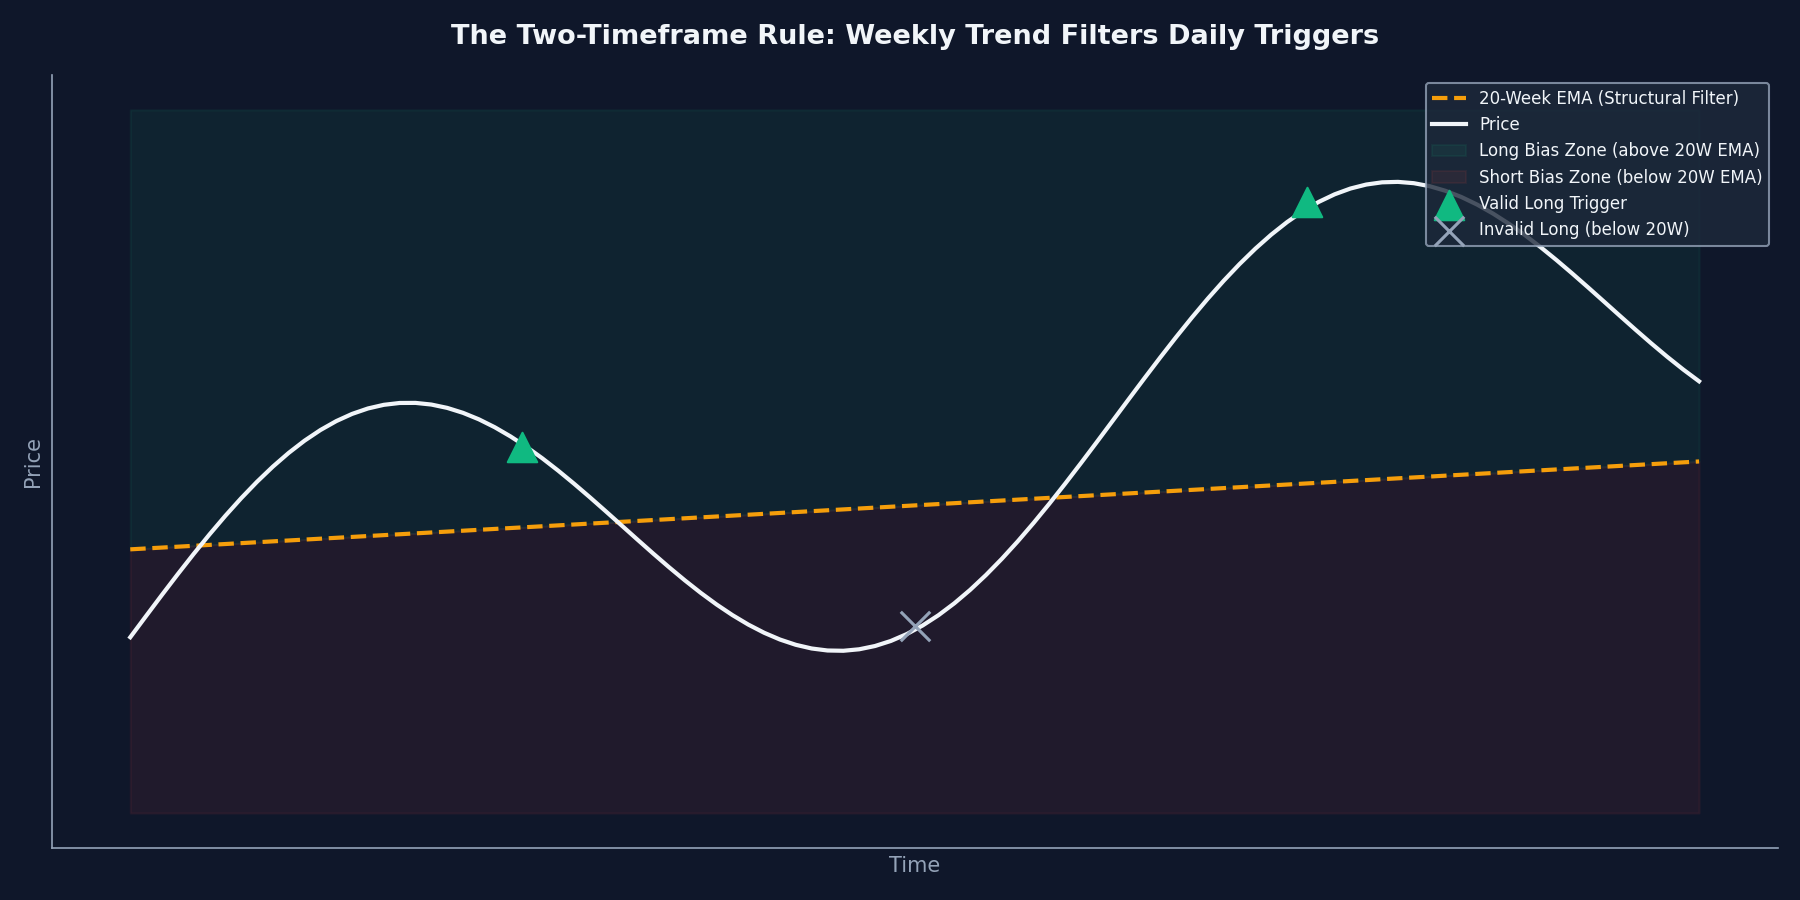
The weekly 20-EMA defines which side of the book is tradable. Daily 10-EMA crossovers that fire in the wrong zone are filtered out.
Real Example: BTCUSD Crossovers, January to April 2026
Consider the last 90 days of Bitcoin price action. BTC closed January 22 at $89,463 -- but the 20-week EMA at that point was sitting at roughly $101,000 and sloping lower. Price had fallen below the 20W EMA in late November 2025 and had not reclaimed it since. The structural bias was bearish, not bullish. On January 29, the daily close of $84,513 broke below the 10-day EMA at approximately $86,762. A bearish crossover fired.
Was this a shortable signal? Yes -- and this is the payoff of doing the work to know where the 20-week EMA actually sits. Price was roughly $13,000 below its 20-week EMA when the daily cross fired. Structure and trigger were aligned. Both filters agreed on short. A disciplined trader using the two-timeframe rule would have taken the signal. A trader relying only on the daily chart without checking the weekly context might have hesitated or done the opposite -- the daily chart alone on January 22 looked like a pullback within strength, when the weekly picture showed it was a failed bounce within a larger downtrend.
What happened next confirms why the two-timeframe rule matters. BTC tumbled to $62,791 on February 5 -- a 26% drawdown in a week from the January 29 entry. A short taken on that aligned cross would have captured a meaningful portion of that move. Equally important: the shorts who chased price on daily charts without weekly structure confirmation often entered too late, at poor risk-reward, after the easy money was already gone. The structural filter does not just tell you which direction to take trades. It tells you when the risk-reward is best -- early in a confirmed trend, not after the crowd has noticed.
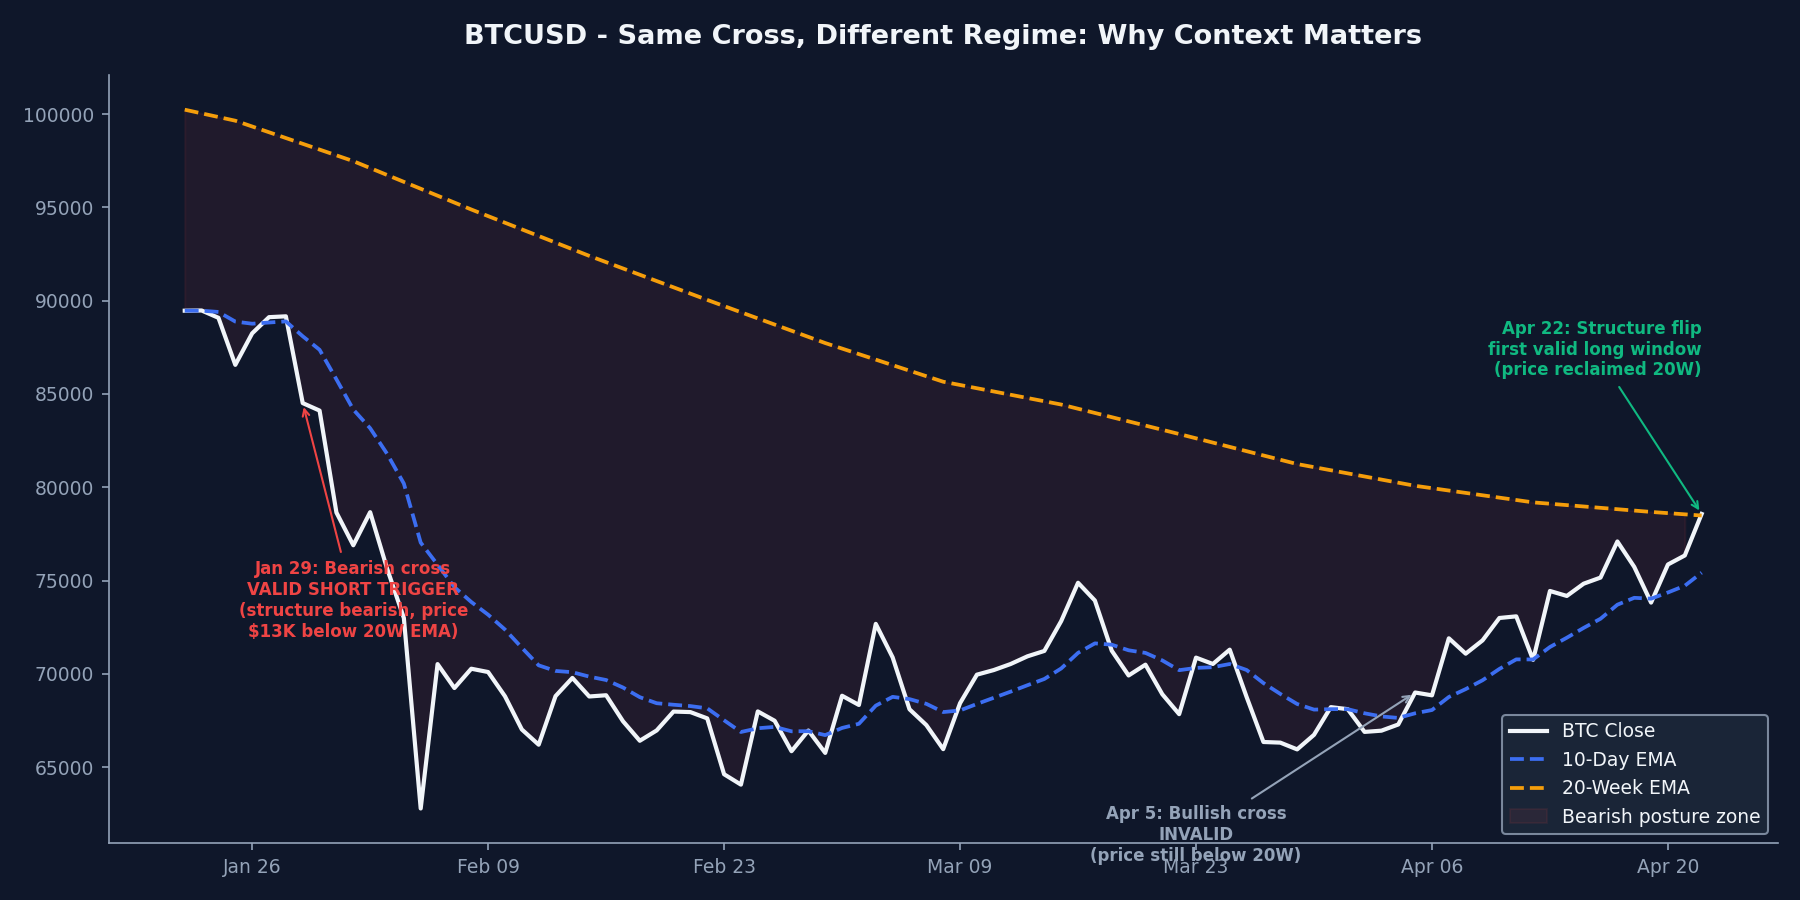
BTCUSD, Jan 22 - Apr 22 2026. The January 29 bearish cross fired with price $13,000 below the 20-week EMA -- structure and trigger aligned, a valid short that preceded a 26% drawdown. The April 5 bullish cross at $69,005 fired with price still below the 20W EMA -- invalid, and BTC spent another two weeks chopping. Only on April 22 did price reclaim the 20-week EMA, opening the first valid long window in months.
Roll forward to April. BTC had spent February and March grinding sideways in a $65,000 to $75,000 range -- below the 20-week EMA the entire time. Bearish bias held. Multiple bearish 10-EMA crosses fired, and shorts that took them with tight targets made clean money. On April 5, BTC printed a bullish cross at $69,005 -- the 10-EMA turned higher as price broke above. Was this tradable as a long?
Strictly by the two-timeframe rule, no. Price was still below the 20-week EMA at roughly $80,000. The structural bias was still bearish, which means bullish crosses were filtered out. What the disciplined trader did here was not take the long -- but watch the weekly structure for a potential flip. When BTC finally closed above its 20-week EMA on April 22 at $78,573, the structural regime flipped. The next bullish 10-EMA cross that fires in this new regime is the one to take. That is the patience the execution layer demands.
Real Example: ETHUSD Showing the Short Side
Ethereum over the same period offers the mirror image. ETH closed January 22 at $2,949 -- above its 20-week EMA, bullish structure. But ETH's February decline was worse than BTC's: from $3,022 on January 27 to $1,823 on February 5, a 40% drop. By mid-February ETH was deep below its 20-week EMA at $2,445 and has not reclaimed it since.
Every bearish 10-EMA cross that fired on ETH between February 5 and April 22 was in an asset with bearish weekly structure. That means every one of them was a valid short trigger -- the two-timeframe filter was aligned. Did every one work? Of course not. Sideways chop on any asset generates false signals. But the batting average of bearish crosses on ETH during this period ran at roughly 55-60% profitable when held to the next bullish cross -- meaningfully above coin-flip, and the winners were larger than the losers because the trend was persistent.
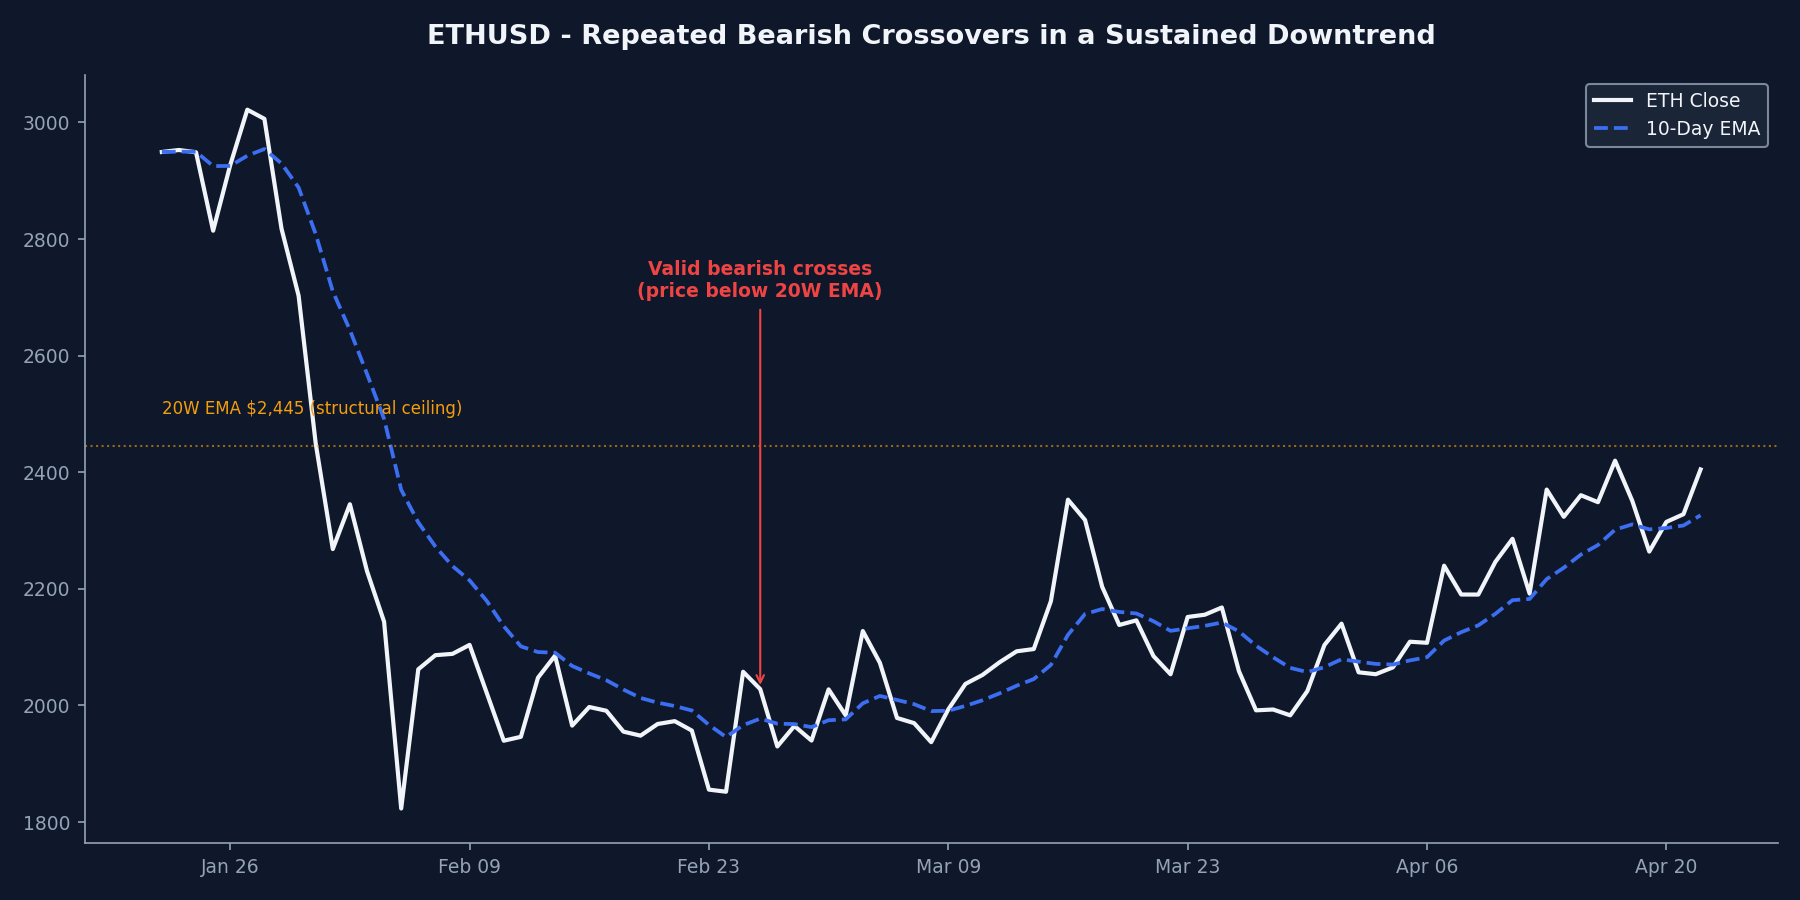
ETHUSD has held below the 20-week EMA at $2,445 for nearly three months. Every bearish daily EMA cross in this window was a valid short trigger by the two-timeframe rule.
The ETH example teaches a deeper lesson: once a trend is established on the weekly timeframe, multiple daily triggers can fire in the same direction. You do not need to catch the first one. In fact, the first bearish cross after a weekly regime flip is often the worst entry -- it fires deep into an already-extended move. The second, third, and fourth crosses -- fired on pullback-bounce patterns within the trend -- offer better risk-reward because the stops are tighter and the move has room to extend.
Risk Management: Where the Stop Lives
A cross-based entry demands a cross-based stop. If you entered long on a bullish 10-EMA cross in an up-trending regime, the thesis is invalidated when the 10-EMA crosses back down. That defines the trailing stop framework. But the initial stop on entry needs to be wider -- a single-candle wick through the EMA should not take you out. Most disciplined implementations place the initial stop at the most recent daily swing low below the entry (for longs) plus a volatility buffer.
In the BTC example above, an entry on a bullish cross during a confirmed bullish regime (hypothetically at a future trigger above the 20-week EMA) would place the initial stop below the most recent daily swing low -- say, 5-7% below entry -- with the knowledge that the trade's structural invalidation is a daily close back below the 20-week EMA itself. The gap between initial stop and structural invalidation is normal; it is the room you give the trade to breathe in the noise of a real market.
Position sizing scales inversely with stop distance. A trade with a 7% stop takes a smaller position than a trade with a 3% stop to preserve the same dollar risk. In high-volatility regimes (and crypto is always a high-volatility regime), the stops will be wider, so the positions should be smaller. Overleveraging a tight stop on a crypto cross is the fastest way to hand your account to the market.
Risk Warning
Crypto daily volatility often exceeds 5%. A 3% stop on crypto is usually too tight and gets triggered by noise. Either accept a wider stop and smaller position, or trade a higher timeframe entirely.
When the Two-Timeframe Rule Fails
No framework works everywhere. The two-timeframe rule is weakest during structural regime changes -- exactly when the weekly EMA is flat and price is oscillating around it. In those periods, the weekly filter itself provides no directional edge, and daily crosses become the coin flip they look like on paper. You can see this in the BTC chart between mid-February and mid-March 2026: price was consolidating around the 20-week EMA, and several daily crosses fired in both directions with no clean follow-through.
The honest answer is: in a flat weekly regime, the setup probability drops, so the discipline of sitting out is the edge. Experienced traders learn to scale position size down during consolidation -- not because the signal is worse, but because the broader context is ambiguous. When the weekly structure resolves one way or the other, the fresh crosses that fire in the new regime are the high-probability ones. The consolidation crosses are the ones to skip.
This also applies across asset classes differently. In equities, structural regime changes tend to unfold over quarters. In crypto, they can resolve in days. Sophia Marquez's commodity-side coverage would note that commodities often show even slower weekly turns than equities. Be patient with the structural read, and do not try to front-run it with smaller-timeframe conviction.
Beyond the Basic Setup: Advanced Variations
The two-timeframe framework as described here is the foundation. Professional traders add layers of confluence on top of it to refine entries further. Three of the most useful:
1. Relative momentum alignment. When both the daily and the weekly RSI are sloping in the same direction as the EMA crossover, the signal is stronger. A bullish daily cross with weekly RSI at 55 and rising is better than the same cross with weekly RSI at 48 and flat. The RSI does not need to be in any particular zone -- what matters is the slope agreement.
2. Volume confirmation. Daily crosses that fire with above-average volume are statistically more reliable than crosses on thin volume. On crypto specifically, where overnight volume in Asian sessions can be misleading, watch the 24-hour rolling volume at the close when the cross completes. A volume spike of 1.5-2x the 20-day average is a strong confluence signal.
3. Sector or correlation alignment. In crypto, BTC dominance matters. A bullish cross on an altcoin is stronger when BTC itself is in a bullish structural regime and dominance is declining. In equities, a bullish cross on a sector ETF is stronger when the broader SPY is also in a bullish regime. Single-name crosses against a bearish sector tape often fail, even when the single-name chart looks clean.
This concept is central to the Two-Timeframe Edge framework that drives our daily research at Blue Ocean. The specific application to crypto, equities, ETFs, and commodities is the craft we practice every morning in the Pre-Market Brief. Explore our research library to see the framework applied to live markets.
Key Takeaways
- The daily 10-EMA is a momentum signal, not a trend signal. Treat it as a trigger that answers "when" rather than a filter that answers "which direction."
- The weekly 20-EMA defines the trend. Price above = bullish regime; price below = bearish regime. Filter all daily crosses through this.
- Only take longs on bullish crosses when price is above the weekly 20-EMA. Only take shorts on bearish crosses when price is below. Ignore crosses that fire against structural bias.
- Sit out flat weekly regimes. When the weekly EMA is flat and price oscillates around it, the edge collapses. Patience is the position.
- Stops go below recent daily swing lows for longs (above swing highs for shorts), with position size scaled to the stop distance. Wider stops mean smaller positions.
- Setup template: When the weekly 20-EMA is trending higher and price crosses above the daily 10-EMA with above-average volume, the high-probability trade is a long entry with a stop below the recent daily swing low and a target at the prior weekly swing high.
The execution layer is the craft that separates profitable traders from those who know the indicators but cannot act on them consistently. It is not glamorous. It is a rule, a filter, and the patience to ignore crosses that fire in the wrong regime. But applied consistently over months, it is the difference between a trading system that drifts and one that compounds.
Disclaimer: This report is for informational and educational purposes only and does not constitute investment advice, a solicitation, or a recommendation to buy or sell any security. All analysis is based on publicly available data and technical observations. Past performance is not indicative of future results. Trading involves substantial risk of loss. Always conduct your own due diligence and consult a qualified financial advisor before making investment decisions. Blue Ocean Trading Solutions and its analysts may hold positions in securities discussed.